holoviews.plotly Package
plotly Package
annotation Module

-
class
holoviews.plotting.plotly.annotation.LabelPlot(element, plot=None, **params)[source]¶ Bases:
holoviews.plotting.plotly.chart.ScatterPlotParameters inherited from:
holoviews.plotting.plot.DimensionedPlot: fontsize, fontscale, show_title, title, title_format, normalize, projectionholoviews.plotting.plot.GenericElementPlot: apply_ranges, apply_extents, default_span, hooks, finalize_hooks, padding, show_grid, xlabel, ylabel, xlim, ylim, zlim, xrotation, yrotationholoviews.plotting.plotly.plot.PlotlyPlot: width, heightholoviews.plotting.plotly.element.ElementPlot: bgcolor, invert_axes, invert_xaxis, invert_yaxis, logx, logy, show_legend, xaxis, yaxis, xticks, yticks, aspect, invert_zaxis, labelled, logz, margins, responsive, zlabel, zticksholoviews.plotting.plotly.element.ColorbarPlot: clim, colorbar, color_levels, colorbar_opts, symmetricholoviews.plotting.plotly.chart.ScatterPlot: color_indexxoffset= param.Number(inclusive_bounds=(True, True))Amount of offset to apply to labels along x-axis.
yoffset= param.Number(inclusive_bounds=(True, True))Amount of offset to apply to labels along x-axis.
-
cleanup()¶ Cleans up references to the plot on the attached Stream subscribers.
-
compute_ranges(obj, key, ranges)¶ Given an object, a specific key, and the normalization options, this method will find the specified normalization options on the appropriate OptionTree, group the elements according to the selected normalization option (i.e. either per frame or over the whole animation) and finally compute the dimension ranges in each group. The new set of ranges is returned.
-
get_aspect(xspan, yspan)¶ Computes the aspect ratio of the plot
-
get_extents(element, ranges, range_type='combined', xdim=None, ydim=None, zdim=None)¶ Gets the extents for the axes from the current Element. The globally computed ranges can optionally override the extents.
The extents are computed by combining the data ranges, extents and dimension ranges. Each of these can be obtained individually by setting the range_type to one of:
‘data’: Just the data ranges
‘extents’: Element.extents
‘soft’: Dimension.soft_range values
‘hard’: Dimension.range values
To obtain the combined range, which includes range padding the default may be used:
‘combined’: All the range types combined and padding applied
This allows Overlay plots to obtain each range and combine them appropriately for all the objects in the overlay.
-
get_padding(obj, extents)¶ Computes padding along the axes taking into account the plot aspect.
-
get_zorder(overlay, key, el)¶ Computes the z-order of element in the NdOverlay taking into account possible batching of elements.
-
init_graph(datum, options, index=0)¶ Initialize the plotly components that will represent the element
- datum: dict
An element of the data list returned by the get_data method
- options: dict
Graph options that were returned by the graph_options method
- index: int
Index of datum in the original list returned by the get_data method
- dict
Dictionary of the plotly components that represent the element. Keys may include:
‘traces’: List of trace dicts
‘annotations’: List of annotations dicts
‘images’: List of image dicts
‘shapes’: List of shape dicts
-
initialize_plot(ranges=None)¶ Initializes a new plot object with the last available frame.
-
property
link_sources¶ Returns potential Link or Stream sources.
-
matches(spec)¶ Matches a specification against the current Plot.
-
push()¶ Pushes plot updates to the frontend.
-
refresh(**kwargs)¶ Refreshes the plot by rerendering it and then pushing the updated data if the plot has an associated Comm.
-
set_root(root)¶ Sets the root model on all subplots.
-
property
state¶ The plotting state that gets updated via the update method and used by the renderer to generate output.
-
traverse(fn=None, specs=None, full_breadth=True)¶ Traverses any nested DimensionedPlot returning a list of all plots that match the specs. The specs should be supplied as a list of either Plot types or callables, which should return a boolean given the plot class.
-
update(key)¶ Update the internal state of the Plot to represent the given key tuple (where integers represent frames). Returns this state.
-
update_frame(key, ranges=None, element=None)¶ Updates an existing plot with data corresponding to the key.
callbacks Module
-
class
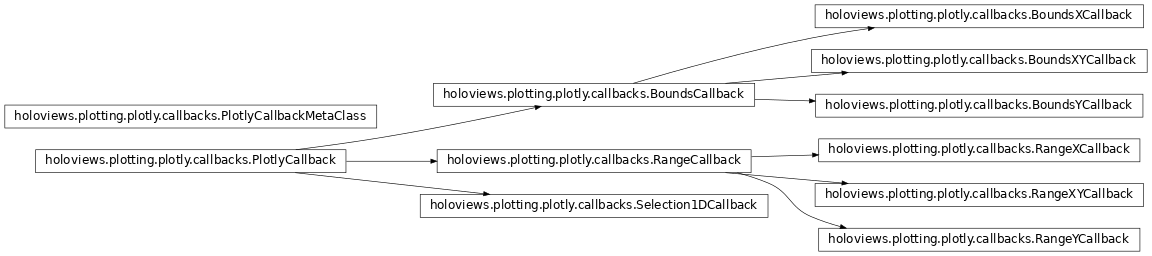
holoviews.plotting.plotly.callbacks.PlotlyCallbackMetaClass(name, bases, attrs)[source]¶ Bases:
typeMetaclass for PlotlyCallback classes.
We want each callback class to keep track of all of the instances of the class. Using a meta class here lets us keep the logic for instance tracking in one place.
-
mro()¶ Return a type’s method resolution order.
-
chart Module
-
class
holoviews.plotting.plotly.chart.AreaPlot(element, plot=None, **params)[source]¶ Bases:
holoviews.plotting.mixins.AreaMixin,holoviews.plotting.plotly.chart.ChartPlotParameters inherited from:
holoviews.plotting.plot.DimensionedPlot: fontsize, fontscale, show_title, title, title_format, normalize, projectionholoviews.plotting.plot.GenericElementPlot: apply_ranges, apply_extents, default_span, hooks, finalize_hooks, show_grid, xlabel, ylabel, xlim, ylim, zlim, xrotation, yrotationholoviews.plotting.plotly.plot.PlotlyPlot: width, heightholoviews.plotting.plotly.element.ElementPlot: bgcolor, invert_axes, invert_xaxis, invert_yaxis, logx, logy, show_legend, xaxis, yaxis, xticks, yticks, aspect, invert_zaxis, labelled, logz, margins, responsive, zlabel, ztickspadding= param.ClassSelector(class_=(<class ‘int’>, <class ‘float’>, <class ‘tuple’>), default=(0, 0.1))Fraction by which to increase auto-ranged extents to make datapoints more visible around borders. To compute padding, the axis whose screen size is largest is chosen, and the range of that axis is increased by the specified fraction along each axis. Other axes are then padded ensuring that the amount of screen space devoted to padding is equal for all axes. If specified as a tuple, the int or float values in the tuple will be used for padding in each axis, in order (x,y or x,y,z). For example, for padding=0.2 on a 800x800-pixel plot, an x-axis with the range [0,10] will be padded by 20% to be [-1,11], while a y-axis with a range [0,1000] will be padded to be [-100,1100], which should make the padding be approximately the same number of pixels. But if the same plot is changed to have a height of only 200, the y-range will then be [-400,1400] so that the y-axis padding will still match that of the x-axis. It is also possible to declare non-equal padding value for the lower and upper bound of an axis by supplying nested tuples, e.g. padding=(0.1, (0, 0.1)) will pad the x-axis lower and upper bound as well as the y-axis upper bound by a fraction of 0.1 while the y-axis lower bound is not padded at all.
-
cleanup()¶ Cleans up references to the plot on the attached Stream subscribers.
-
compute_ranges(obj, key, ranges)¶ Given an object, a specific key, and the normalization options, this method will find the specified normalization options on the appropriate OptionTree, group the elements according to the selected normalization option (i.e. either per frame or over the whole animation) and finally compute the dimension ranges in each group. The new set of ranges is returned.
-
get_aspect(xspan, yspan)¶ Computes the aspect ratio of the plot
-
get_padding(obj, extents)¶ Computes padding along the axes taking into account the plot aspect.
-
get_zorder(overlay, key, el)¶ Computes the z-order of element in the NdOverlay taking into account possible batching of elements.
-
init_graph(datum, options, index=0)¶ Initialize the plotly components that will represent the element
- datum: dict
An element of the data list returned by the get_data method
- options: dict
Graph options that were returned by the graph_options method
- index: int
Index of datum in the original list returned by the get_data method
- dict
Dictionary of the plotly components that represent the element. Keys may include:
‘traces’: List of trace dicts
‘annotations’: List of annotations dicts
‘images’: List of image dicts
‘shapes’: List of shape dicts
-
initialize_plot(ranges=None)¶ Initializes a new plot object with the last available frame.
-
property
link_sources¶ Returns potential Link or Stream sources.
-
matches(spec)¶ Matches a specification against the current Plot.
-
push()¶ Pushes plot updates to the frontend.
-
refresh(**kwargs)¶ Refreshes the plot by rerendering it and then pushing the updated data if the plot has an associated Comm.
-
set_root(root)¶ Sets the root model on all subplots.
-
property
state¶ The plotting state that gets updated via the update method and used by the renderer to generate output.
-
traverse(fn=None, specs=None, full_breadth=True)¶ Traverses any nested DimensionedPlot returning a list of all plots that match the specs. The specs should be supplied as a list of either Plot types or callables, which should return a boolean given the plot class.
-
update(key)¶ Update the internal state of the Plot to represent the given key tuple (where integers represent frames). Returns this state.
-
update_frame(key, ranges=None, element=None)¶ Updates an existing plot with data corresponding to the key.
-
class
holoviews.plotting.plotly.chart.BarPlot(element, plot=None, **params)[source]¶ Bases:
holoviews.plotting.mixins.BarsMixin,holoviews.plotting.plotly.element.ElementPlotParameters inherited from:
holoviews.plotting.plot.DimensionedPlot: fontsize, fontscale, show_title, title, title_format, normalize, projectionholoviews.plotting.plot.GenericElementPlot: apply_ranges, apply_extents, default_span, hooks, finalize_hooks, padding, show_grid, xlabel, ylabel, xlim, ylim, zlim, xrotation, yrotationholoviews.plotting.plotly.plot.PlotlyPlot: width, heightholoviews.plotting.plotly.element.ElementPlot: bgcolor, invert_axes, invert_xaxis, invert_yaxis, logx, logy, xaxis, yaxis, xticks, yticks, aspect, invert_zaxis, labelled, logz, margins, responsive, zlabel, zticksshow_legend= param.Boolean(bounds=(0, 1), default=True)Whether to show legend for the plot.
multi_level= param.Boolean(bounds=(0, 1), default=True)Whether the Bars should be grouped into a second categorical axis level.
stacked= param.Boolean(bounds=(0, 1), default=False)-
cleanup()¶ Cleans up references to the plot on the attached Stream subscribers.
-
compute_ranges(obj, key, ranges)¶ Given an object, a specific key, and the normalization options, this method will find the specified normalization options on the appropriate OptionTree, group the elements according to the selected normalization option (i.e. either per frame or over the whole animation) and finally compute the dimension ranges in each group. The new set of ranges is returned.
-
get_aspect(xspan, yspan)¶ Computes the aspect ratio of the plot
-
get_extents(element, ranges, range_type='combined')[source]¶ Make adjustments to plot extents by computing stacked bar heights, adjusting the bar baseline and forcing the x-axis to be categorical.
-
get_padding(obj, extents)¶ Computes padding along the axes taking into account the plot aspect.
-
get_zorder(overlay, key, el)¶ Computes the z-order of element in the NdOverlay taking into account possible batching of elements.
-
init_graph(datum, options, index=0)¶ Initialize the plotly components that will represent the element
- datum: dict
An element of the data list returned by the get_data method
- options: dict
Graph options that were returned by the graph_options method
- index: int
Index of datum in the original list returned by the get_data method
- dict
Dictionary of the plotly components that represent the element. Keys may include:
‘traces’: List of trace dicts
‘annotations’: List of annotations dicts
‘images’: List of image dicts
‘shapes’: List of shape dicts
-
initialize_plot(ranges=None)¶ Initializes a new plot object with the last available frame.
-
property
link_sources¶ Returns potential Link or Stream sources.
-
matches(spec)¶ Matches a specification against the current Plot.
-
push()¶ Pushes plot updates to the frontend.
-
refresh(**kwargs)¶ Refreshes the plot by rerendering it and then pushing the updated data if the plot has an associated Comm.
-
set_root(root)¶ Sets the root model on all subplots.
-
property
state¶ The plotting state that gets updated via the update method and used by the renderer to generate output.
-
traverse(fn=None, specs=None, full_breadth=True)¶ Traverses any nested DimensionedPlot returning a list of all plots that match the specs. The specs should be supplied as a list of either Plot types or callables, which should return a boolean given the plot class.
-
update(key)¶ Update the internal state of the Plot to represent the given key tuple (where integers represent frames). Returns this state.
-
update_frame(key, ranges=None, element=None)¶ Updates an existing plot with data corresponding to the key.
-
class
holoviews.plotting.plotly.chart.ChartPlot(element, plot=None, **params)[source]¶ Bases:
holoviews.plotting.plotly.element.ElementPlotParameters inherited from:
holoviews.plotting.plot.DimensionedPlot: fontsize, fontscale, show_title, title, title_format, normalize, projectionholoviews.plotting.plot.GenericElementPlot: apply_ranges, apply_extents, default_span, hooks, finalize_hooks, padding, show_grid, xlabel, ylabel, xlim, ylim, zlim, xrotation, yrotationholoviews.plotting.plotly.plot.PlotlyPlot: width, heightholoviews.plotting.plotly.element.ElementPlot: bgcolor, invert_axes, invert_xaxis, invert_yaxis, logx, logy, show_legend, xaxis, yaxis, xticks, yticks, aspect, invert_zaxis, labelled, logz, margins, responsive, zlabel, zticks-
cleanup()¶ Cleans up references to the plot on the attached Stream subscribers.
-
compute_ranges(obj, key, ranges)¶ Given an object, a specific key, and the normalization options, this method will find the specified normalization options on the appropriate OptionTree, group the elements according to the selected normalization option (i.e. either per frame or over the whole animation) and finally compute the dimension ranges in each group. The new set of ranges is returned.
-
get_aspect(xspan, yspan)¶ Computes the aspect ratio of the plot
-
get_extents(element, ranges, range_type='combined', xdim=None, ydim=None, zdim=None)¶ Gets the extents for the axes from the current Element. The globally computed ranges can optionally override the extents.
The extents are computed by combining the data ranges, extents and dimension ranges. Each of these can be obtained individually by setting the range_type to one of:
‘data’: Just the data ranges
‘extents’: Element.extents
‘soft’: Dimension.soft_range values
‘hard’: Dimension.range values
To obtain the combined range, which includes range padding the default may be used:
‘combined’: All the range types combined and padding applied
This allows Overlay plots to obtain each range and combine them appropriately for all the objects in the overlay.
-
get_padding(obj, extents)¶ Computes padding along the axes taking into account the plot aspect.
-
get_zorder(overlay, key, el)¶ Computes the z-order of element in the NdOverlay taking into account possible batching of elements.
-
init_graph(datum, options, index=0)¶ Initialize the plotly components that will represent the element
- datum: dict
An element of the data list returned by the get_data method
- options: dict
Graph options that were returned by the graph_options method
- index: int
Index of datum in the original list returned by the get_data method
- dict
Dictionary of the plotly components that represent the element. Keys may include:
‘traces’: List of trace dicts
‘annotations’: List of annotations dicts
‘images’: List of image dicts
‘shapes’: List of shape dicts
-
initialize_plot(ranges=None)¶ Initializes a new plot object with the last available frame.
-
property
link_sources¶ Returns potential Link or Stream sources.
-
matches(spec)¶ Matches a specification against the current Plot.
-
push()¶ Pushes plot updates to the frontend.
-
refresh(**kwargs)¶ Refreshes the plot by rerendering it and then pushing the updated data if the plot has an associated Comm.
-
set_root(root)¶ Sets the root model on all subplots.
-
property
state¶ The plotting state that gets updated via the update method and used by the renderer to generate output.
-
traverse(fn=None, specs=None, full_breadth=True)¶ Traverses any nested DimensionedPlot returning a list of all plots that match the specs. The specs should be supplied as a list of either Plot types or callables, which should return a boolean given the plot class.
-
update(key)¶ Update the internal state of the Plot to represent the given key tuple (where integers represent frames). Returns this state.
-
update_frame(key, ranges=None, element=None)¶ Updates an existing plot with data corresponding to the key.
-
-
class
holoviews.plotting.plotly.chart.CurvePlot(element, plot=None, **params)[source]¶ Bases:
holoviews.plotting.plotly.chart.ChartPlot,holoviews.plotting.plotly.element.ColorbarPlotParameters inherited from:
holoviews.plotting.plot.DimensionedPlot: fontsize, fontscale, show_title, title, title_format, normalize, projectionholoviews.plotting.plot.GenericElementPlot: apply_ranges, apply_extents, default_span, hooks, finalize_hooks, show_grid, xlabel, ylabel, xlim, ylim, zlim, xrotation, yrotationholoviews.plotting.plotly.plot.PlotlyPlot: width, heightholoviews.plotting.plotly.element.ElementPlot: bgcolor, invert_axes, invert_xaxis, invert_yaxis, logx, logy, show_legend, xaxis, yaxis, xticks, yticks, aspect, invert_zaxis, labelled, logz, margins, responsive, zlabel, zticksholoviews.plotting.plotly.element.ColorbarPlot: clim, colorbar, color_levels, colorbar_opts, symmetricpadding= param.ClassSelector(class_=(<class ‘int’>, <class ‘float’>, <class ‘tuple’>), default=(0, 0.1))Fraction by which to increase auto-ranged extents to make datapoints more visible around borders. To compute padding, the axis whose screen size is largest is chosen, and the range of that axis is increased by the specified fraction along each axis. Other axes are then padded ensuring that the amount of screen space devoted to padding is equal for all axes. If specified as a tuple, the int or float values in the tuple will be used for padding in each axis, in order (x,y or x,y,z). For example, for padding=0.2 on a 800x800-pixel plot, an x-axis with the range [0,10] will be padded by 20% to be [-1,11], while a y-axis with a range [0,1000] will be padded to be [-100,1100], which should make the padding be approximately the same number of pixels. But if the same plot is changed to have a height of only 200, the y-range will then be [-400,1400] so that the y-axis padding will still match that of the x-axis. It is also possible to declare non-equal padding value for the lower and upper bound of an axis by supplying nested tuples, e.g. padding=(0.1, (0, 0.1)) will pad the x-axis lower and upper bound as well as the y-axis upper bound by a fraction of 0.1 while the y-axis lower bound is not padded at all.
interpolation= param.ObjectSelector(default=’linear’, objects=[‘linear’, ‘steps-mid’, ‘steps-pre’, ‘steps-post’])Defines how the samples of the Curve are interpolated, default is ‘linear’, other options include ‘steps-mid’, ‘steps-pre’ and ‘steps-post’.
-
cleanup()¶ Cleans up references to the plot on the attached Stream subscribers.
-
compute_ranges(obj, key, ranges)¶ Given an object, a specific key, and the normalization options, this method will find the specified normalization options on the appropriate OptionTree, group the elements according to the selected normalization option (i.e. either per frame or over the whole animation) and finally compute the dimension ranges in each group. The new set of ranges is returned.
-
get_aspect(xspan, yspan)¶ Computes the aspect ratio of the plot
-
get_extents(element, ranges, range_type='combined', xdim=None, ydim=None, zdim=None)¶ Gets the extents for the axes from the current Element. The globally computed ranges can optionally override the extents.
The extents are computed by combining the data ranges, extents and dimension ranges. Each of these can be obtained individually by setting the range_type to one of:
‘data’: Just the data ranges
‘extents’: Element.extents
‘soft’: Dimension.soft_range values
‘hard’: Dimension.range values
To obtain the combined range, which includes range padding the default may be used:
‘combined’: All the range types combined and padding applied
This allows Overlay plots to obtain each range and combine them appropriately for all the objects in the overlay.
-
get_padding(obj, extents)¶ Computes padding along the axes taking into account the plot aspect.
-
get_zorder(overlay, key, el)¶ Computes the z-order of element in the NdOverlay taking into account possible batching of elements.
-
init_graph(datum, options, index=0)¶ Initialize the plotly components that will represent the element
- datum: dict
An element of the data list returned by the get_data method
- options: dict
Graph options that were returned by the graph_options method
- index: int
Index of datum in the original list returned by the get_data method
- dict
Dictionary of the plotly components that represent the element. Keys may include:
‘traces’: List of trace dicts
‘annotations’: List of annotations dicts
‘images’: List of image dicts
‘shapes’: List of shape dicts
-
initialize_plot(ranges=None)¶ Initializes a new plot object with the last available frame.
-
property
link_sources¶ Returns potential Link or Stream sources.
-
matches(spec)¶ Matches a specification against the current Plot.
-
push()¶ Pushes plot updates to the frontend.
-
refresh(**kwargs)¶ Refreshes the plot by rerendering it and then pushing the updated data if the plot has an associated Comm.
-
set_root(root)¶ Sets the root model on all subplots.
-
property
state¶ The plotting state that gets updated via the update method and used by the renderer to generate output.
-
traverse(fn=None, specs=None, full_breadth=True)¶ Traverses any nested DimensionedPlot returning a list of all plots that match the specs. The specs should be supplied as a list of either Plot types or callables, which should return a boolean given the plot class.
-
update(key)¶ Update the internal state of the Plot to represent the given key tuple (where integers represent frames). Returns this state.
-
update_frame(key, ranges=None, element=None)¶ Updates an existing plot with data corresponding to the key.
-
class
holoviews.plotting.plotly.chart.ErrorBarsPlot(element, plot=None, **params)[source]¶ Bases:
holoviews.plotting.plotly.chart.ChartPlot,holoviews.plotting.plotly.element.ColorbarPlotParameters inherited from:
holoviews.plotting.plot.DimensionedPlot: fontsize, fontscale, show_title, title, title_format, normalize, projectionholoviews.plotting.plot.GenericElementPlot: apply_ranges, apply_extents, default_span, hooks, finalize_hooks, padding, show_grid, xlabel, ylabel, xlim, ylim, zlim, xrotation, yrotationholoviews.plotting.plotly.plot.PlotlyPlot: width, heightholoviews.plotting.plotly.element.ElementPlot: bgcolor, invert_axes, invert_xaxis, invert_yaxis, logx, logy, show_legend, xaxis, yaxis, xticks, yticks, aspect, invert_zaxis, labelled, logz, margins, responsive, zlabel, zticksholoviews.plotting.plotly.element.ColorbarPlot: clim, colorbar, color_levels, colorbar_opts, symmetric-
cleanup()¶ Cleans up references to the plot on the attached Stream subscribers.
-
compute_ranges(obj, key, ranges)¶ Given an object, a specific key, and the normalization options, this method will find the specified normalization options on the appropriate OptionTree, group the elements according to the selected normalization option (i.e. either per frame or over the whole animation) and finally compute the dimension ranges in each group. The new set of ranges is returned.
-
get_aspect(xspan, yspan)¶ Computes the aspect ratio of the plot
-
get_extents(element, ranges, range_type='combined', xdim=None, ydim=None, zdim=None)¶ Gets the extents for the axes from the current Element. The globally computed ranges can optionally override the extents.
The extents are computed by combining the data ranges, extents and dimension ranges. Each of these can be obtained individually by setting the range_type to one of:
‘data’: Just the data ranges
‘extents’: Element.extents
‘soft’: Dimension.soft_range values
‘hard’: Dimension.range values
To obtain the combined range, which includes range padding the default may be used:
‘combined’: All the range types combined and padding applied
This allows Overlay plots to obtain each range and combine them appropriately for all the objects in the overlay.
-
get_padding(obj, extents)¶ Computes padding along the axes taking into account the plot aspect.
-
get_zorder(overlay, key, el)¶ Computes the z-order of element in the NdOverlay taking into account possible batching of elements.
-
init_graph(datum, options, index=0)¶ Initialize the plotly components that will represent the element
- datum: dict
An element of the data list returned by the get_data method
- options: dict
Graph options that were returned by the graph_options method
- index: int
Index of datum in the original list returned by the get_data method
- dict
Dictionary of the plotly components that represent the element. Keys may include:
‘traces’: List of trace dicts
‘annotations’: List of annotations dicts
‘images’: List of image dicts
‘shapes’: List of shape dicts
-
initialize_plot(ranges=None)¶ Initializes a new plot object with the last available frame.
-
property
link_sources¶ Returns potential Link or Stream sources.
-
matches(spec)¶ Matches a specification against the current Plot.
-
push()¶ Pushes plot updates to the frontend.
-
refresh(**kwargs)¶ Refreshes the plot by rerendering it and then pushing the updated data if the plot has an associated Comm.
-
set_root(root)¶ Sets the root model on all subplots.
-
property
state¶ The plotting state that gets updated via the update method and used by the renderer to generate output.
-
traverse(fn=None, specs=None, full_breadth=True)¶ Traverses any nested DimensionedPlot returning a list of all plots that match the specs. The specs should be supplied as a list of either Plot types or callables, which should return a boolean given the plot class.
-
update(key)¶ Update the internal state of the Plot to represent the given key tuple (where integers represent frames). Returns this state.
-
update_frame(key, ranges=None, element=None)¶ Updates an existing plot with data corresponding to the key.
-
-
class
holoviews.plotting.plotly.chart.HistogramPlot(element, plot=None, **params)[source]¶ Bases:
holoviews.plotting.plotly.element.ElementPlotParameters inherited from:
holoviews.plotting.plot.DimensionedPlot: fontsize, fontscale, show_title, title, title_format, normalize, projectionholoviews.plotting.plot.GenericElementPlot: apply_ranges, apply_extents, default_span, hooks, finalize_hooks, padding, show_grid, xlabel, ylabel, xlim, ylim, zlim, xrotation, yrotationholoviews.plotting.plotly.plot.PlotlyPlot: width, heightholoviews.plotting.plotly.element.ElementPlot: bgcolor, invert_axes, invert_xaxis, invert_yaxis, logx, logy, show_legend, xaxis, yaxis, xticks, yticks, aspect, invert_zaxis, labelled, logz, margins, responsive, zlabel, zticks-
cleanup()¶ Cleans up references to the plot on the attached Stream subscribers.
-
compute_ranges(obj, key, ranges)¶ Given an object, a specific key, and the normalization options, this method will find the specified normalization options on the appropriate OptionTree, group the elements according to the selected normalization option (i.e. either per frame or over the whole animation) and finally compute the dimension ranges in each group. The new set of ranges is returned.
-
get_aspect(xspan, yspan)¶ Computes the aspect ratio of the plot
-
get_extents(element, ranges, range_type='combined', xdim=None, ydim=None, zdim=None)¶ Gets the extents for the axes from the current Element. The globally computed ranges can optionally override the extents.
The extents are computed by combining the data ranges, extents and dimension ranges. Each of these can be obtained individually by setting the range_type to one of:
‘data’: Just the data ranges
‘extents’: Element.extents
‘soft’: Dimension.soft_range values
‘hard’: Dimension.range values
To obtain the combined range, which includes range padding the default may be used:
‘combined’: All the range types combined and padding applied
This allows Overlay plots to obtain each range and combine them appropriately for all the objects in the overlay.
-
get_padding(obj, extents)¶ Computes padding along the axes taking into account the plot aspect.
-
get_zorder(overlay, key, el)¶ Computes the z-order of element in the NdOverlay taking into account possible batching of elements.
-
init_graph(datum, options, index=0)¶ Initialize the plotly components that will represent the element
- datum: dict
An element of the data list returned by the get_data method
- options: dict
Graph options that were returned by the graph_options method
- index: int
Index of datum in the original list returned by the get_data method
- dict
Dictionary of the plotly components that represent the element. Keys may include:
‘traces’: List of trace dicts
‘annotations’: List of annotations dicts
‘images’: List of image dicts
‘shapes’: List of shape dicts
-
initialize_plot(ranges=None)¶ Initializes a new plot object with the last available frame.
-
property
link_sources¶ Returns potential Link or Stream sources.
-
matches(spec)¶ Matches a specification against the current Plot.
-
push()¶ Pushes plot updates to the frontend.
-
refresh(**kwargs)¶ Refreshes the plot by rerendering it and then pushing the updated data if the plot has an associated Comm.
-
set_root(root)¶ Sets the root model on all subplots.
-
property
state¶ The plotting state that gets updated via the update method and used by the renderer to generate output.
-
traverse(fn=None, specs=None, full_breadth=True)¶ Traverses any nested DimensionedPlot returning a list of all plots that match the specs. The specs should be supplied as a list of either Plot types or callables, which should return a boolean given the plot class.
-
update(key)¶ Update the internal state of the Plot to represent the given key tuple (where integers represent frames). Returns this state.
-
update_frame(key, ranges=None, element=None)¶ Updates an existing plot with data corresponding to the key.
-
-
class
holoviews.plotting.plotly.chart.ScatterPlot(element, plot=None, **params)[source]¶ Bases:
holoviews.plotting.plotly.chart.ChartPlot,holoviews.plotting.plotly.element.ColorbarPlotParameters inherited from:
holoviews.plotting.plot.DimensionedPlot: fontsize, fontscale, show_title, title, title_format, normalize, projectionholoviews.plotting.plot.GenericElementPlot: apply_ranges, apply_extents, default_span, hooks, finalize_hooks, padding, show_grid, xlabel, ylabel, xlim, ylim, zlim, xrotation, yrotationholoviews.plotting.plotly.plot.PlotlyPlot: width, heightholoviews.plotting.plotly.element.ElementPlot: bgcolor, invert_axes, invert_xaxis, invert_yaxis, logx, logy, show_legend, xaxis, yaxis, xticks, yticks, aspect, invert_zaxis, labelled, logz, margins, responsive, zlabel, zticksholoviews.plotting.plotly.element.ColorbarPlot: clim, colorbar, color_levels, colorbar_opts, symmetriccolor_index= param.ClassSelector(class_=(<class ‘str’>, <class ‘int’>))Index of the dimension from which the color will the drawn
-
cleanup()¶ Cleans up references to the plot on the attached Stream subscribers.
-
compute_ranges(obj, key, ranges)¶ Given an object, a specific key, and the normalization options, this method will find the specified normalization options on the appropriate OptionTree, group the elements according to the selected normalization option (i.e. either per frame or over the whole animation) and finally compute the dimension ranges in each group. The new set of ranges is returned.
-
get_aspect(xspan, yspan)¶ Computes the aspect ratio of the plot
-
get_extents(element, ranges, range_type='combined', xdim=None, ydim=None, zdim=None)¶ Gets the extents for the axes from the current Element. The globally computed ranges can optionally override the extents.
The extents are computed by combining the data ranges, extents and dimension ranges. Each of these can be obtained individually by setting the range_type to one of:
‘data’: Just the data ranges
‘extents’: Element.extents
‘soft’: Dimension.soft_range values
‘hard’: Dimension.range values
To obtain the combined range, which includes range padding the default may be used:
‘combined’: All the range types combined and padding applied
This allows Overlay plots to obtain each range and combine them appropriately for all the objects in the overlay.
-
get_padding(obj, extents)¶ Computes padding along the axes taking into account the plot aspect.
-
get_zorder(overlay, key, el)¶ Computes the z-order of element in the NdOverlay taking into account possible batching of elements.
-
init_graph(datum, options, index=0)¶ Initialize the plotly components that will represent the element
- datum: dict
An element of the data list returned by the get_data method
- options: dict
Graph options that were returned by the graph_options method
- index: int
Index of datum in the original list returned by the get_data method
- dict
Dictionary of the plotly components that represent the element. Keys may include:
‘traces’: List of trace dicts
‘annotations’: List of annotations dicts
‘images’: List of image dicts
‘shapes’: List of shape dicts
-
initialize_plot(ranges=None)¶ Initializes a new plot object with the last available frame.
-
property
link_sources¶ Returns potential Link or Stream sources.
-
matches(spec)¶ Matches a specification against the current Plot.
-
push()¶ Pushes plot updates to the frontend.
-
refresh(**kwargs)¶ Refreshes the plot by rerendering it and then pushing the updated data if the plot has an associated Comm.
-
set_root(root)¶ Sets the root model on all subplots.
-
property
state¶ The plotting state that gets updated via the update method and used by the renderer to generate output.
-
traverse(fn=None, specs=None, full_breadth=True)¶ Traverses any nested DimensionedPlot returning a list of all plots that match the specs. The specs should be supplied as a list of either Plot types or callables, which should return a boolean given the plot class.
-
update(key)¶ Update the internal state of the Plot to represent the given key tuple (where integers represent frames). Returns this state.
-
update_frame(key, ranges=None, element=None)¶ Updates an existing plot with data corresponding to the key.
-
class
holoviews.plotting.plotly.chart.SpreadPlot(element, plot=None, **params)[source]¶ Bases:
holoviews.plotting.plotly.chart.ChartPlotParameters inherited from:
holoviews.plotting.plot.DimensionedPlot: fontsize, fontscale, show_title, title, title_format, normalize, projectionholoviews.plotting.plot.GenericElementPlot: apply_ranges, apply_extents, default_span, hooks, finalize_hooks, show_grid, xlabel, ylabel, xlim, ylim, zlim, xrotation, yrotationholoviews.plotting.plotly.plot.PlotlyPlot: width, heightholoviews.plotting.plotly.element.ElementPlot: bgcolor, invert_axes, invert_xaxis, invert_yaxis, logx, logy, show_legend, xaxis, yaxis, xticks, yticks, aspect, invert_zaxis, labelled, logz, margins, responsive, zlabel, ztickspadding= param.ClassSelector(class_=(<class ‘int’>, <class ‘float’>, <class ‘tuple’>), default=(0, 0.1))Fraction by which to increase auto-ranged extents to make datapoints more visible around borders. To compute padding, the axis whose screen size is largest is chosen, and the range of that axis is increased by the specified fraction along each axis. Other axes are then padded ensuring that the amount of screen space devoted to padding is equal for all axes. If specified as a tuple, the int or float values in the tuple will be used for padding in each axis, in order (x,y or x,y,z). For example, for padding=0.2 on a 800x800-pixel plot, an x-axis with the range [0,10] will be padded by 20% to be [-1,11], while a y-axis with a range [0,1000] will be padded to be [-100,1100], which should make the padding be approximately the same number of pixels. But if the same plot is changed to have a height of only 200, the y-range will then be [-400,1400] so that the y-axis padding will still match that of the x-axis. It is also possible to declare non-equal padding value for the lower and upper bound of an axis by supplying nested tuples, e.g. padding=(0.1, (0, 0.1)) will pad the x-axis lower and upper bound as well as the y-axis upper bound by a fraction of 0.1 while the y-axis lower bound is not padded at all.
-
cleanup()¶ Cleans up references to the plot on the attached Stream subscribers.
-
compute_ranges(obj, key, ranges)¶ Given an object, a specific key, and the normalization options, this method will find the specified normalization options on the appropriate OptionTree, group the elements according to the selected normalization option (i.e. either per frame or over the whole animation) and finally compute the dimension ranges in each group. The new set of ranges is returned.
-
get_aspect(xspan, yspan)¶ Computes the aspect ratio of the plot
-
get_extents(element, ranges, range_type='combined', xdim=None, ydim=None, zdim=None)¶ Gets the extents for the axes from the current Element. The globally computed ranges can optionally override the extents.
The extents are computed by combining the data ranges, extents and dimension ranges. Each of these can be obtained individually by setting the range_type to one of:
‘data’: Just the data ranges
‘extents’: Element.extents
‘soft’: Dimension.soft_range values
‘hard’: Dimension.range values
To obtain the combined range, which includes range padding the default may be used:
‘combined’: All the range types combined and padding applied
This allows Overlay plots to obtain each range and combine them appropriately for all the objects in the overlay.
-
get_padding(obj, extents)¶ Computes padding along the axes taking into account the plot aspect.
-
get_zorder(overlay, key, el)¶ Computes the z-order of element in the NdOverlay taking into account possible batching of elements.
-
init_graph(datum, options, index=0)¶ Initialize the plotly components that will represent the element
- datum: dict
An element of the data list returned by the get_data method
- options: dict
Graph options that were returned by the graph_options method
- index: int
Index of datum in the original list returned by the get_data method
- dict
Dictionary of the plotly components that represent the element. Keys may include:
‘traces’: List of trace dicts
‘annotations’: List of annotations dicts
‘images’: List of image dicts
‘shapes’: List of shape dicts
-
initialize_plot(ranges=None)¶ Initializes a new plot object with the last available frame.
-
property
link_sources¶ Returns potential Link or Stream sources.
-
matches(spec)¶ Matches a specification against the current Plot.
-
push()¶ Pushes plot updates to the frontend.
-
refresh(**kwargs)¶ Refreshes the plot by rerendering it and then pushing the updated data if the plot has an associated Comm.
-
set_root(root)¶ Sets the root model on all subplots.
-
property
state¶ The plotting state that gets updated via the update method and used by the renderer to generate output.
-
traverse(fn=None, specs=None, full_breadth=True)¶ Traverses any nested DimensionedPlot returning a list of all plots that match the specs. The specs should be supplied as a list of either Plot types or callables, which should return a boolean given the plot class.
-
update(key)¶ Update the internal state of the Plot to represent the given key tuple (where integers represent frames). Returns this state.
-
update_frame(key, ranges=None, element=None)¶ Updates an existing plot with data corresponding to the key.
chart3d Module

-
class
holoviews.plotting.plotly.chart3d.Chart3DPlot(element, plot=None, **params)[source]¶ Bases:
holoviews.plotting.plotly.element.ElementPlotParameters inherited from:
holoviews.plotting.plot.DimensionedPlot: fontsize, fontscale, show_title, title, title_format, normalizeholoviews.plotting.plot.GenericElementPlot: apply_ranges, apply_extents, default_span, hooks, finalize_hooks, padding, show_grid, xlabel, ylabel, xlim, ylim, zlim, xrotation, yrotationholoviews.plotting.plotly.element.ElementPlot: bgcolor, invert_axes, invert_xaxis, invert_yaxis, logx, logy, show_legend, xaxis, yaxis, xticks, yticks, invert_zaxis, labelled, logz, margins, responsive, zlabelprojection= param.String(default=’3d’)Allows supplying a custom projection to transform the axis coordinates during display. Example projections include ‘3d’ and ‘polar’ projections supported by some backends. Depending on the backend custom, projection objects may be supplied.
width= param.Integer(default=500, inclusive_bounds=(True, True))height= param.Integer(default=500, inclusive_bounds=(True, True))aspect= param.Parameter(default=’cube’)The aspect ratio mode of the plot. By default, a plot may select its own appropriate aspect ratio but sometimes it may be necessary to force a square aspect ratio (e.g. to display the plot as an element of a grid). The modes ‘auto’ and ‘equal’ correspond to the axis modes of the same name in matplotlib, a numeric value may also be passed.
zticks= param.Parameter()Ticks along z-axis specified as an integer, explicit list of tick locations, list of tuples containing the locations.
camera_angle= param.NumericTuple(default=(0.2, 0.5, 0.1, 0.2), length=4)camera_position= param.NumericTuple(default=(0.1, 0, -0.1), length=3)camera_zoom= param.Integer(default=3, inclusive_bounds=(True, True))-
cleanup()¶ Cleans up references to the plot on the attached Stream subscribers.
-
compute_ranges(obj, key, ranges)¶ Given an object, a specific key, and the normalization options, this method will find the specified normalization options on the appropriate OptionTree, group the elements according to the selected normalization option (i.e. either per frame or over the whole animation) and finally compute the dimension ranges in each group. The new set of ranges is returned.
-
get_aspect(xspan, yspan)¶ Computes the aspect ratio of the plot
-
get_extents(element, ranges, range_type='combined', xdim=None, ydim=None, zdim=None)¶ Gets the extents for the axes from the current Element. The globally computed ranges can optionally override the extents.
The extents are computed by combining the data ranges, extents and dimension ranges. Each of these can be obtained individually by setting the range_type to one of:
‘data’: Just the data ranges
‘extents’: Element.extents
‘soft’: Dimension.soft_range values
‘hard’: Dimension.range values
To obtain the combined range, which includes range padding the default may be used:
‘combined’: All the range types combined and padding applied
This allows Overlay plots to obtain each range and combine them appropriately for all the objects in the overlay.
-
get_padding(obj, extents)¶ Computes padding along the axes taking into account the plot aspect.
-
get_zorder(overlay, key, el)¶ Computes the z-order of element in the NdOverlay taking into account possible batching of elements.
-
init_graph(datum, options, index=0)¶ Initialize the plotly components that will represent the element
- datum: dict
An element of the data list returned by the get_data method
- options: dict
Graph options that were returned by the graph_options method
- index: int
Index of datum in the original list returned by the get_data method
- dict
Dictionary of the plotly components that represent the element. Keys may include:
‘traces’: List of trace dicts
‘annotations’: List of annotations dicts
‘images’: List of image dicts
‘shapes’: List of shape dicts
-
initialize_plot(ranges=None)¶ Initializes a new plot object with the last available frame.
-
property
link_sources¶ Returns potential Link or Stream sources.
-
matches(spec)¶ Matches a specification against the current Plot.
-
push()¶ Pushes plot updates to the frontend.
-
refresh(**kwargs)¶ Refreshes the plot by rerendering it and then pushing the updated data if the plot has an associated Comm.
-
set_root(root)¶ Sets the root model on all subplots.
-
property
state¶ The plotting state that gets updated via the update method and used by the renderer to generate output.
-
traverse(fn=None, specs=None, full_breadth=True)¶ Traverses any nested DimensionedPlot returning a list of all plots that match the specs. The specs should be supplied as a list of either Plot types or callables, which should return a boolean given the plot class.
-
update(key)¶ Update the internal state of the Plot to represent the given key tuple (where integers represent frames). Returns this state.
-
update_frame(key, ranges=None, element=None)¶ Updates an existing plot with data corresponding to the key.
-
class
holoviews.plotting.plotly.chart3d.Path3DPlot(element, plot=None, **params)[source]¶ Bases:
holoviews.plotting.plotly.chart3d.Chart3DPlot,holoviews.plotting.plotly.chart.CurvePlotParameters inherited from:
holoviews.plotting.plot.DimensionedPlot: fontsize, fontscale, show_title, title, title_format, normalizeholoviews.plotting.plot.GenericElementPlot: apply_ranges, apply_extents, default_span, hooks, finalize_hooks, show_grid, xlabel, ylabel, xlim, ylim, zlim, xrotation, yrotationholoviews.plotting.plotly.element.ElementPlot: bgcolor, invert_axes, invert_xaxis, invert_yaxis, logx, logy, show_legend, xaxis, yaxis, xticks, yticks, invert_zaxis, labelled, logz, margins, responsive, zlabelholoviews.plotting.plotly.element.ColorbarPlot: clim, colorbar, color_levels, colorbar_opts, symmetricholoviews.plotting.plotly.chart.CurvePlot: padding, interpolationholoviews.plotting.plotly.chart3d.Chart3DPlot: projection, width, height, aspect, zticks, camera_angle, camera_position, camera_zoom-
cleanup()¶ Cleans up references to the plot on the attached Stream subscribers.
-
compute_ranges(obj, key, ranges)¶ Given an object, a specific key, and the normalization options, this method will find the specified normalization options on the appropriate OptionTree, group the elements according to the selected normalization option (i.e. either per frame or over the whole animation) and finally compute the dimension ranges in each group. The new set of ranges is returned.
-
get_aspect(xspan, yspan)¶ Computes the aspect ratio of the plot
-
get_extents(element, ranges, range_type='combined', xdim=None, ydim=None, zdim=None)¶ Gets the extents for the axes from the current Element. The globally computed ranges can optionally override the extents.
The extents are computed by combining the data ranges, extents and dimension ranges. Each of these can be obtained individually by setting the range_type to one of:
‘data’: Just the data ranges
‘extents’: Element.extents
‘soft’: Dimension.soft_range values
‘hard’: Dimension.range values
To obtain the combined range, which includes range padding the default may be used:
‘combined’: All the range types combined and padding applied
This allows Overlay plots to obtain each range and combine them appropriately for all the objects in the overlay.
-
get_padding(obj, extents)¶ Computes padding along the axes taking into account the plot aspect.
-
get_zorder(overlay, key, el)¶ Computes the z-order of element in the NdOverlay taking into account possible batching of elements.
-
init_graph(datum, options, index=0)¶ Initialize the plotly components that will represent the element
- datum: dict
An element of the data list returned by the get_data method
- options: dict
Graph options that were returned by the graph_options method
- index: int
Index of datum in the original list returned by the get_data method
- dict
Dictionary of the plotly components that represent the element. Keys may include:
‘traces’: List of trace dicts
‘annotations’: List of annotations dicts
‘images’: List of image dicts
‘shapes’: List of shape dicts
-
initialize_plot(ranges=None)¶ Initializes a new plot object with the last available frame.
-
property
link_sources¶ Returns potential Link or Stream sources.
-
matches(spec)¶ Matches a specification against the current Plot.
-
push()¶ Pushes plot updates to the frontend.
-
refresh(**kwargs)¶ Refreshes the plot by rerendering it and then pushing the updated data if the plot has an associated Comm.
-
set_root(root)¶ Sets the root model on all subplots.
-
property
state¶ The plotting state that gets updated via the update method and used by the renderer to generate output.
-
traverse(fn=None, specs=None, full_breadth=True)¶ Traverses any nested DimensionedPlot returning a list of all plots that match the specs. The specs should be supplied as a list of either Plot types or callables, which should return a boolean given the plot class.
-
update(key)¶ Update the internal state of the Plot to represent the given key tuple (where integers represent frames). Returns this state.
-
update_frame(key, ranges=None, element=None)¶ Updates an existing plot with data corresponding to the key.
-
-
class
holoviews.plotting.plotly.chart3d.Scatter3DPlot(element, plot=None, **params)[source]¶ Bases:
holoviews.plotting.plotly.chart3d.Chart3DPlot,holoviews.plotting.plotly.chart.ScatterPlotParameters inherited from:
holoviews.plotting.plot.DimensionedPlot: fontsize, fontscale, show_title, title, title_format, normalizeholoviews.plotting.plot.GenericElementPlot: apply_ranges, apply_extents, default_span, hooks, finalize_hooks, padding, show_grid, xlabel, ylabel, xlim, ylim, zlim, xrotation, yrotationholoviews.plotting.plotly.element.ElementPlot: bgcolor, invert_axes, invert_xaxis, invert_yaxis, logx, logy, show_legend, xaxis, yaxis, xticks, yticks, invert_zaxis, labelled, logz, margins, responsive, zlabelholoviews.plotting.plotly.element.ColorbarPlot: clim, colorbar, color_levels, colorbar_opts, symmetricholoviews.plotting.plotly.chart.ScatterPlot: color_indexholoviews.plotting.plotly.chart3d.Chart3DPlot: projection, width, height, aspect, zticks, camera_angle, camera_position, camera_zoom-
cleanup()¶ Cleans up references to the plot on the attached Stream subscribers.
-
compute_ranges(obj, key, ranges)¶ Given an object, a specific key, and the normalization options, this method will find the specified normalization options on the appropriate OptionTree, group the elements according to the selected normalization option (i.e. either per frame or over the whole animation) and finally compute the dimension ranges in each group. The new set of ranges is returned.
-
get_aspect(xspan, yspan)¶ Computes the aspect ratio of the plot
-
get_extents(element, ranges, range_type='combined', xdim=None, ydim=None, zdim=None)¶ Gets the extents for the axes from the current Element. The globally computed ranges can optionally override the extents.
The extents are computed by combining the data ranges, extents and dimension ranges. Each of these can be obtained individually by setting the range_type to one of:
‘data’: Just the data ranges
‘extents’: Element.extents
‘soft’: Dimension.soft_range values
‘hard’: Dimension.range values
To obtain the combined range, which includes range padding the default may be used:
‘combined’: All the range types combined and padding applied
This allows Overlay plots to obtain each range and combine them appropriately for all the objects in the overlay.
-
get_padding(obj, extents)¶ Computes padding along the axes taking into account the plot aspect.
-
get_zorder(overlay, key, el)¶ Computes the z-order of element in the NdOverlay taking into account possible batching of elements.
-
init_graph(datum, options, index=0)¶ Initialize the plotly components that will represent the element
- datum: dict
An element of the data list returned by the get_data method
- options: dict
Graph options that were returned by the graph_options method
- index: int
Index of datum in the original list returned by the get_data method
- dict
Dictionary of the plotly components that represent the element. Keys may include:
‘traces’: List of trace dicts
‘annotations’: List of annotations dicts
‘images’: List of image dicts
‘shapes’: List of shape dicts
-
initialize_plot(ranges=None)¶ Initializes a new plot object with the last available frame.
-
property
link_sources¶ Returns potential Link or Stream sources.
-
matches(spec)¶ Matches a specification against the current Plot.
-
push()¶ Pushes plot updates to the frontend.
-
refresh(**kwargs)¶ Refreshes the plot by rerendering it and then pushing the updated data if the plot has an associated Comm.
-
set_root(root)¶ Sets the root model on all subplots.
-
property
state¶ The plotting state that gets updated via the update method and used by the renderer to generate output.
-
traverse(fn=None, specs=None, full_breadth=True)¶ Traverses any nested DimensionedPlot returning a list of all plots that match the specs. The specs should be supplied as a list of either Plot types or callables, which should return a boolean given the plot class.
-
update(key)¶ Update the internal state of the Plot to represent the given key tuple (where integers represent frames). Returns this state.
-
update_frame(key, ranges=None, element=None)¶ Updates an existing plot with data corresponding to the key.
-
-
class
holoviews.plotting.plotly.chart3d.SurfacePlot(element, plot=None, **params)[source]¶ Bases:
holoviews.plotting.plotly.chart3d.Chart3DPlot,holoviews.plotting.plotly.element.ColorbarPlotParameters inherited from:
holoviews.plotting.plot.DimensionedPlot: fontsize, fontscale, show_title, title, title_format, normalizeholoviews.plotting.plot.GenericElementPlot: apply_ranges, apply_extents, default_span, hooks, finalize_hooks, padding, show_grid, xlabel, ylabel, xlim, ylim, zlim, xrotation, yrotationholoviews.plotting.plotly.element.ElementPlot: bgcolor, invert_axes, invert_xaxis, invert_yaxis, logx, logy, show_legend, xaxis, yaxis, xticks, yticks, invert_zaxis, labelled, logz, margins, responsive, zlabelholoviews.plotting.plotly.element.ColorbarPlot: clim, colorbar, color_levels, colorbar_opts, symmetricholoviews.plotting.plotly.chart3d.Chart3DPlot: projection, width, height, aspect, zticks, camera_angle, camera_position, camera_zoom-
cleanup()¶ Cleans up references to the plot on the attached Stream subscribers.
-
compute_ranges(obj, key, ranges)¶ Given an object, a specific key, and the normalization options, this method will find the specified normalization options on the appropriate OptionTree, group the elements according to the selected normalization option (i.e. either per frame or over the whole animation) and finally compute the dimension ranges in each group. The new set of ranges is returned.
-
get_aspect(xspan, yspan)¶ Computes the aspect ratio of the plot
-
get_extents(element, ranges, range_type='combined', xdim=None, ydim=None, zdim=None)¶ Gets the extents for the axes from the current Element. The globally computed ranges can optionally override the extents.
The extents are computed by combining the data ranges, extents and dimension ranges. Each of these can be obtained individually by setting the range_type to one of:
‘data’: Just the data ranges
‘extents’: Element.extents
‘soft’: Dimension.soft_range values
‘hard’: Dimension.range values
To obtain the combined range, which includes range padding the default may be used:
‘combined’: All the range types combined and padding applied
This allows Overlay plots to obtain each range and combine them appropriately for all the objects in the overlay.
-
get_padding(obj, extents)¶ Computes padding along the axes taking into account the plot aspect.
-
get_zorder(overlay, key, el)¶ Computes the z-order of element in the NdOverlay taking into account possible batching of elements.
-
init_graph(datum, options, index=0)¶ Initialize the plotly components that will represent the element
- datum: dict
An element of the data list returned by the get_data method
- options: dict
Graph options that were returned by the graph_options method
- index: int
Index of datum in the original list returned by the get_data method
- dict
Dictionary of the plotly components that represent the element. Keys may include:
‘traces’: List of trace dicts
‘annotations’: List of annotations dicts
‘images’: List of image dicts
‘shapes’: List of shape dicts
-
initialize_plot(ranges=None)¶ Initializes a new plot object with the last available frame.
-
property
link_sources¶ Returns potential Link or Stream sources.
-
matches(spec)¶ Matches a specification against the current Plot.
-
push()¶ Pushes plot updates to the frontend.
-
refresh(**kwargs)¶ Refreshes the plot by rerendering it and then pushing the updated data if the plot has an associated Comm.
-
set_root(root)¶ Sets the root model on all subplots.
-
property
state¶ The plotting state that gets updated via the update method and used by the renderer to generate output.
-
traverse(fn=None, specs=None, full_breadth=True)¶ Traverses any nested DimensionedPlot returning a list of all plots that match the specs. The specs should be supplied as a list of either Plot types or callables, which should return a boolean given the plot class.
-
update(key)¶ Update the internal state of the Plot to represent the given key tuple (where integers represent frames). Returns this state.
-
update_frame(key, ranges=None, element=None)¶ Updates an existing plot with data corresponding to the key.
-
-
class
holoviews.plotting.plotly.chart3d.TriSurfacePlot(element, plot=None, **params)[source]¶ Bases:
holoviews.plotting.plotly.chart3d.Chart3DPlot,holoviews.plotting.plotly.element.ColorbarPlotParameters inherited from:
holoviews.plotting.plot.DimensionedPlot: fontsize, fontscale, show_title, title, title_format, normalizeholoviews.plotting.plot.GenericElementPlot: apply_ranges, apply_extents, default_span, hooks, finalize_hooks, padding, show_grid, xlabel, ylabel, xlim, ylim, zlim, xrotation, yrotationholoviews.plotting.plotly.element.ElementPlot: bgcolor, invert_axes, invert_xaxis, invert_yaxis, logx, logy, show_legend, xaxis, yaxis, xticks, yticks, invert_zaxis, labelled, logz, margins, responsive, zlabelholoviews.plotting.plotly.element.ColorbarPlot: clim, colorbar, color_levels, colorbar_opts, symmetricholoviews.plotting.plotly.chart3d.Chart3DPlot: projection, width, height, aspect, zticks, camera_angle, camera_position, camera_zoom-
cleanup()¶ Cleans up references to the plot on the attached Stream subscribers.
-
compute_ranges(obj, key, ranges)¶ Given an object, a specific key, and the normalization options, this method will find the specified normalization options on the appropriate OptionTree, group the elements according to the selected normalization option (i.e. either per frame or over the whole animation) and finally compute the dimension ranges in each group. The new set of ranges is returned.
-
get_aspect(xspan, yspan)¶ Computes the aspect ratio of the plot
-
get_extents(element, ranges, range_type='combined', xdim=None, ydim=None, zdim=None)¶ Gets the extents for the axes from the current Element. The globally computed ranges can optionally override the extents.
The extents are computed by combining the data ranges, extents and dimension ranges. Each of these can be obtained individually by setting the range_type to one of:
‘data’: Just the data ranges
‘extents’: Element.extents
‘soft’: Dimension.soft_range values
‘hard’: Dimension.range values
To obtain the combined range, which includes range padding the default may be used:
‘combined’: All the range types combined and padding applied
This allows Overlay plots to obtain each range and combine them appropriately for all the objects in the overlay.
-
get_padding(obj, extents)¶ Computes padding along the axes taking into account the plot aspect.
-
get_zorder(overlay, key, el)¶ Computes the z-order of element in the NdOverlay taking into account possible batching of elements.
-
init_graph(datum, options, index=0)[source]¶ Initialize the plotly components that will represent the element
- datum: dict
An element of the data list returned by the get_data method
- options: dict
Graph options that were returned by the graph_options method
- index: int
Index of datum in the original list returned by the get_data method
- dict
Dictionary of the plotly components that represent the element. Keys may include:
‘traces’: List of trace dicts
‘annotations’: List of annotations dicts
‘images’: List of image dicts
‘shapes’: List of shape dicts
-
initialize_plot(ranges=None)¶ Initializes a new plot object with the last available frame.
-
property
link_sources¶ Returns potential Link or Stream sources.
-
matches(spec)¶ Matches a specification against the current Plot.
-
push()¶ Pushes plot updates to the frontend.
-
refresh(**kwargs)¶ Refreshes the plot by rerendering it and then pushing the updated data if the plot has an associated Comm.
-
set_root(root)¶ Sets the root model on all subplots.
-
property
state¶ The plotting state that gets updated via the update method and used by the renderer to generate output.
-
traverse(fn=None, specs=None, full_breadth=True)¶ Traverses any nested DimensionedPlot returning a list of all plots that match the specs. The specs should be supplied as a list of either Plot types or callables, which should return a boolean given the plot class.
-
update(key)¶ Update the internal state of the Plot to represent the given key tuple (where integers represent frames). Returns this state.
-
update_frame(key, ranges=None, element=None)¶ Updates an existing plot with data corresponding to the key.
-
element Module

-
class
holoviews.plotting.plotly.element.ColorbarPlot(element, plot=None, **params)[source]¶ Bases:
holoviews.plotting.plotly.element.ElementPlotParameters inherited from:
holoviews.plotting.plot.DimensionedPlot: fontsize, fontscale, show_title, title, title_format, normalize, projectionholoviews.plotting.plot.GenericElementPlot: apply_ranges, apply_extents, default_span, hooks, finalize_hooks, padding, show_grid, xlabel, ylabel, xlim, ylim, zlim, xrotation, yrotationholoviews.plotting.plotly.plot.PlotlyPlot: width, heightholoviews.plotting.plotly.element.ElementPlot: bgcolor, invert_axes, invert_xaxis, invert_yaxis, logx, logy, show_legend, xaxis, yaxis, xticks, yticks, aspect, invert_zaxis, labelled, logz, margins, responsive, zlabel, zticksclim= param.NumericTuple(default=(nan, nan), length=2)User-specified colorbar axis range limits for the plot, as a tuple (low,high). If specified, takes precedence over data and dimension ranges.
colorbar= param.Boolean(bounds=(0, 1), default=False)Whether to display a colorbar.
color_levels= param.ClassSelector(class_=(<class ‘int’>, <class ‘list’>))Number of discrete colors to use when colormapping or a set of color intervals defining the range of values to map each color to.
colorbar_opts= param.Dict(class_=<class ‘dict’>, default={})Allows setting including borderwidth, showexponent, nticks, outlinecolor, thickness, bgcolor, outlinewidth, bordercolor, ticklen, xpad, ypad, tickangle…
symmetric= param.Boolean(bounds=(0, 1), default=False)Whether to make the colormap symmetric around zero.
-
cleanup()¶ Cleans up references to the plot on the attached Stream subscribers.
-
compute_ranges(obj, key, ranges)¶ Given an object, a specific key, and the normalization options, this method will find the specified normalization options on the appropriate OptionTree, group the elements according to the selected normalization option (i.e. either per frame or over the whole animation) and finally compute the dimension ranges in each group. The new set of ranges is returned.
-
get_aspect(xspan, yspan)¶ Computes the aspect ratio of the plot
-
get_extents(element, ranges, range_type='combined', xdim=None, ydim=None, zdim=None)¶ Gets the extents for the axes from the current Element. The globally computed ranges can optionally override the extents.
The extents are computed by combining the data ranges, extents and dimension ranges. Each of these can be obtained individually by setting the range_type to one of:
‘data’: Just the data ranges
‘extents’: Element.extents
‘soft’: Dimension.soft_range values
‘hard’: Dimension.range values
To obtain the combined range, which includes range padding the default may be used:
‘combined’: All the range types combined and padding applied
This allows Overlay plots to obtain each range and combine them appropriately for all the objects in the overlay.
-
get_padding(obj, extents)¶ Computes padding along the axes taking into account the plot aspect.
-
get_zorder(overlay, key, el)¶ Computes the z-order of element in the NdOverlay taking into account possible batching of elements.
-
init_graph(datum, options, index=0)¶ Initialize the plotly components that will represent the element
- datum: dict
An element of the data list returned by the get_data method
- options: dict
Graph options that were returned by the graph_options method
- index: int
Index of datum in the original list returned by the get_data method
- dict
Dictionary of the plotly components that represent the element. Keys may include:
‘traces’: List of trace dicts
‘annotations’: List of annotations dicts
‘images’: List of image dicts
‘shapes’: List of shape dicts
-
initialize_plot(ranges=None)¶ Initializes a new plot object with the last available frame.
-
property
link_sources¶ Returns potential Link or Stream sources.
-
matches(spec)¶ Matches a specification against the current Plot.
-
push()¶ Pushes plot updates to the frontend.
-
refresh(**kwargs)¶ Refreshes the plot by rerendering it and then pushing the updated data if the plot has an associated Comm.
-
set_root(root)¶ Sets the root model on all subplots.
-
property
state¶ The plotting state that gets updated via the update method and used by the renderer to generate output.
-
traverse(fn=None, specs=None, full_breadth=True)¶ Traverses any nested DimensionedPlot returning a list of all plots that match the specs. The specs should be supplied as a list of either Plot types or callables, which should return a boolean given the plot class.
-
update(key)¶ Update the internal state of the Plot to represent the given key tuple (where integers represent frames). Returns this state.
-
update_frame(key, ranges=None, element=None)¶ Updates an existing plot with data corresponding to the key.
-
class
holoviews.plotting.plotly.element.ElementPlot(element, plot=None, **params)[source]¶ Bases:
holoviews.plotting.plotly.plot.PlotlyPlot,holoviews.plotting.plot.GenericElementPlotParameters inherited from:
holoviews.plotting.plot.DimensionedPlot: fontsize, fontscale, show_title, title, title_format, normalize, projectionholoviews.plotting.plot.GenericElementPlot: apply_ranges, apply_extents, default_span, hooks, finalize_hooks, padding, show_grid, xlabel, ylabel, xlim, ylim, zlim, xrotation, yrotationholoviews.plotting.plotly.plot.PlotlyPlot: width, heightbgcolor= param.ClassSelector(class_=(<class ‘str’>, <class ‘tuple’>))If set bgcolor overrides the background color of the axis.
invert_axes= param.ObjectSelector(default=False, objects=[])Inverts the axes of the plot. Note that this parameter may not always be respected by all plots but should be respected by adjoined plots when appropriate.
invert_xaxis= param.Boolean(bounds=(0, 1), default=False)Whether to invert the plot x-axis.
invert_yaxis= param.Boolean(bounds=(0, 1), default=False)Whether to invert the plot y-axis.
logx= param.Boolean(bounds=(0, 1), default=False)Whether to apply log scaling to the x-axis of the Chart.
logy= param.Boolean(bounds=(0, 1), default=False)Whether to apply log scaling to the y-axis of the Chart.
show_legend= param.Boolean(bounds=(0, 1), default=False)Whether to show legend for the plot.
xaxis= param.ObjectSelector(default=’bottom’, objects=[‘top’, ‘bottom’, ‘bare’, ‘top-bare’, ‘bottom-bare’, None])Whether and where to display the xaxis, bare options allow suppressing all axis labels including ticks and xlabel. Valid options are ‘top’, ‘bottom’, ‘bare’, ‘top-bare’ and ‘bottom-bare’.
yaxis= param.ObjectSelector(default=’left’, objects=[‘left’, ‘right’, ‘bare’, ‘left-bare’, ‘right-bare’, None])Whether and where to display the yaxis, bare options allow suppressing all axis labels including ticks and ylabel. Valid options are ‘left’, ‘right’, ‘bare’ ‘left-bare’ and ‘right-bare’.
xticks= param.Parameter()Ticks along x-axis specified as an integer, explicit list of tick locations, list of tuples containing the locations.
yticks= param.Parameter()Ticks along y-axis specified as an integer, explicit list of tick locations, list of tuples containing the locations.
aspect= param.Parameter(default=’cube’)The aspect ratio mode of the plot. By default, a plot may select its own appropriate aspect ratio but sometimes it may be necessary to force a square aspect ratio (e.g. to display the plot as an element of a grid). The modes ‘auto’ and ‘equal’ correspond to the axis modes of the same name in matplotlib, a numeric value may also be passed.
invert_zaxis= param.Boolean(bounds=(0, 1), default=False)Whether to invert the plot z-axis.
labelled= param.List(bounds=(0, None), default=[‘x’, ‘y’, ‘z’])Whether to label the ‘x’ and ‘y’ axes.
logz= param.Boolean(bounds=(0, 1), default=False)Whether to apply log scaling to the y-axis of the Chart.
margins= param.NumericTuple(default=(50, 50, 50, 50), length=4)Margins in pixel values specified as a tuple of the form (left, bottom, right, top).
responsive= param.Boolean(bounds=(0, 1), default=False)Whether the plot should stretch to fill the available space.
zlabel= param.String()An explicit override of the z-axis label, if set takes precedence over the dimension label.
zticks= param.Parameter()Ticks along z-axis specified as an integer, explicit list of tick locations, list of tuples containing the locations.
-
cleanup()¶ Cleans up references to the plot on the attached Stream subscribers.
-
compute_ranges(obj, key, ranges)¶ Given an object, a specific key, and the normalization options, this method will find the specified normalization options on the appropriate OptionTree, group the elements according to the selected normalization option (i.e. either per frame or over the whole animation) and finally compute the dimension ranges in each group. The new set of ranges is returned.
-
get_extents(element, ranges, range_type='combined', xdim=None, ydim=None, zdim=None)¶ Gets the extents for the axes from the current Element. The globally computed ranges can optionally override the extents.
The extents are computed by combining the data ranges, extents and dimension ranges. Each of these can be obtained individually by setting the range_type to one of:
‘data’: Just the data ranges
‘extents’: Element.extents
‘soft’: Dimension.soft_range values
‘hard’: Dimension.range values
To obtain the combined range, which includes range padding the default may be used:
‘combined’: All the range types combined and padding applied
This allows Overlay plots to obtain each range and combine them appropriately for all the objects in the overlay.
-
get_padding(obj, extents)¶ Computes padding along the axes taking into account the plot aspect.
-
get_zorder(overlay, key, el)¶ Computes the z-order of element in the NdOverlay taking into account possible batching of elements.
-
init_graph(datum, options, index=0)[source]¶ Initialize the plotly components that will represent the element
- datum: dict
An element of the data list returned by the get_data method
- options: dict
Graph options that were returned by the graph_options method
- index: int
Index of datum in the original list returned by the get_data method
- dict
Dictionary of the plotly components that represent the element. Keys may include:
‘traces’: List of trace dicts
‘annotations’: List of annotations dicts
‘images’: List of image dicts
‘shapes’: List of shape dicts
-
property
link_sources¶ Returns potential Link or Stream sources.
-
matches(spec)¶ Matches a specification against the current Plot.
-
push()¶ Pushes plot updates to the frontend.
-
refresh(**kwargs)¶ Refreshes the plot by rerendering it and then pushing the updated data if the plot has an associated Comm.
-
set_root(root)¶ Sets the root model on all subplots.
-
property
state¶ The plotting state that gets updated via the update method and used by the renderer to generate output.
-
traverse(fn=None, specs=None, full_breadth=True)¶ Traverses any nested DimensionedPlot returning a list of all plots that match the specs. The specs should be supplied as a list of either Plot types or callables, which should return a boolean given the plot class.
-
update(key)¶ Update the internal state of the Plot to represent the given key tuple (where integers represent frames). Returns this state.
-
class
holoviews.plotting.plotly.element.OverlayPlot(overlay, ranges=None, batched=True, keys=None, group_counter=None, **params)[source]¶ Bases:
holoviews.plotting.plot.GenericOverlayPlot,holoviews.plotting.plotly.element.ElementPlotParameters inherited from:
holoviews.plotting.plot.DimensionedPlot: fontsize, fontscale, show_title, title, title_format, normalize, projectionholoviews.plotting.plot.GenericElementPlot: apply_ranges, apply_extents, default_span, hooks, finalize_hooks, padding, show_grid, xlabel, ylabel, xlim, ylim, zlim, xrotation, yrotationholoviews.plotting.plotly.plot.PlotlyPlot: width, heightholoviews.plotting.plotly.element.ElementPlot: bgcolor, invert_axes, invert_xaxis, invert_yaxis, logx, logy, xaxis, yaxis, xticks, yticks, aspect, invert_zaxis, labelled, logz, margins, responsive, zlabel, zticksholoviews.plotting.plot.GenericOverlayPlot: show_legend, batched, legend_limit, style_grouping-
cleanup()¶ Cleans up references to the plot on the attached Stream subscribers.
-
compute_ranges(obj, key, ranges)¶ Given an object, a specific key, and the normalization options, this method will find the specified normalization options on the appropriate OptionTree, group the elements according to the selected normalization option (i.e. either per frame or over the whole animation) and finally compute the dimension ranges in each group. The new set of ranges is returned.
-
get_aspect(xspan, yspan)¶ Computes the aspect ratio of the plot
-
get_extents(overlay, ranges, range_type='combined')¶ Gets the extents for the axes from the current Element. The globally computed ranges can optionally override the extents.
The extents are computed by combining the data ranges, extents and dimension ranges. Each of these can be obtained individually by setting the range_type to one of:
‘data’: Just the data ranges
‘extents’: Element.extents
‘soft’: Dimension.soft_range values
‘hard’: Dimension.range values
To obtain the combined range, which includes range padding the default may be used:
‘combined’: All the range types combined and padding applied
This allows Overlay plots to obtain each range and combine them appropriately for all the objects in the overlay.
-
get_padding(obj, extents)¶ Computes padding along the axes taking into account the plot aspect.
-
get_zorder(overlay, key, el)¶ Computes the z-order of element in the NdOverlay taking into account possible batching of elements.
-
init_graph(datum, options, index=0)¶ Initialize the plotly components that will represent the element
- datum: dict
An element of the data list returned by the get_data method
- options: dict
Graph options that were returned by the graph_options method
- index: int
Index of datum in the original list returned by the get_data method
- dict
Dictionary of the plotly components that represent the element. Keys may include:
‘traces’: List of trace dicts
‘annotations’: List of annotations dicts
‘images’: List of image dicts
‘shapes’: List of shape dicts
-
property
link_sources¶ Returns potential Link or Stream sources.
-
matches(spec)¶ Matches a specification against the current Plot.
-
push()¶ Pushes plot updates to the frontend.
-
refresh(**kwargs)¶ Refreshes the plot by rerendering it and then pushing the updated data if the plot has an associated Comm.
-
set_root(root)¶ Sets the root model on all subplots.
-
property
state¶ The plotting state that gets updated via the update method and used by the renderer to generate output.
-
traverse(fn=None, specs=None, full_breadth=True)¶ Traverses any nested DimensionedPlot returning a list of all plots that match the specs. The specs should be supplied as a list of either Plot types or callables, which should return a boolean given the plot class.
-
update(key)¶ Update the internal state of the Plot to represent the given key tuple (where integers represent frames). Returns this state.
-
images Module

-
class
holoviews.plotting.plotly.images.RGBPlot(element, plot=None, **params)[source]¶ Bases:
holoviews.plotting.plotly.element.ElementPlotParameters inherited from:
holoviews.plotting.plot.DimensionedPlot: fontsize, fontscale, show_title, title, title_format, normalize, projectionholoviews.plotting.plot.GenericElementPlot: apply_ranges, apply_extents, default_span, hooks, finalize_hooks, padding, show_grid, xlabel, ylabel, xlim, ylim, zlim, xrotation, yrotationholoviews.plotting.plotly.plot.PlotlyPlot: width, heightholoviews.plotting.plotly.element.ElementPlot: bgcolor, invert_axes, invert_xaxis, invert_yaxis, logx, logy, show_legend, xaxis, yaxis, xticks, yticks, aspect, invert_zaxis, labelled, logz, margins, responsive, zlabel, zticks-
cleanup()¶ Cleans up references to the plot on the attached Stream subscribers.
-
compute_ranges(obj, key, ranges)¶ Given an object, a specific key, and the normalization options, this method will find the specified normalization options on the appropriate OptionTree, group the elements according to the selected normalization option (i.e. either per frame or over the whole animation) and finally compute the dimension ranges in each group. The new set of ranges is returned.
-
get_aspect(xspan, yspan)¶ Computes the aspect ratio of the plot
-
get_extents(element, ranges, range_type='combined', xdim=None, ydim=None, zdim=None)¶ Gets the extents for the axes from the current Element. The globally computed ranges can optionally override the extents.
The extents are computed by combining the data ranges, extents and dimension ranges. Each of these can be obtained individually by setting the range_type to one of:
‘data’: Just the data ranges
‘extents’: Element.extents
‘soft’: Dimension.soft_range values
‘hard’: Dimension.range values
To obtain the combined range, which includes range padding the default may be used:
‘combined’: All the range types combined and padding applied
This allows Overlay plots to obtain each range and combine them appropriately for all the objects in the overlay.
-
get_padding(obj, extents)¶ Computes padding along the axes taking into account the plot aspect.
-
get_zorder(overlay, key, el)¶ Computes the z-order of element in the NdOverlay taking into account possible batching of elements.
-
init_graph(datum, options, index=0)[source]¶ Initialize the plotly components that will represent the element
- datum: dict
An element of the data list returned by the get_data method
- options: dict
Graph options that were returned by the graph_options method
- index: int
Index of datum in the original list returned by the get_data method
- dict
Dictionary of the plotly components that represent the element. Keys may include:
‘traces’: List of trace dicts
‘annotations’: List of annotations dicts
‘images’: List of image dicts
‘shapes’: List of shape dicts
-
initialize_plot(ranges=None)¶ Initializes a new plot object with the last available frame.
-
property
link_sources¶ Returns potential Link or Stream sources.
-
matches(spec)¶ Matches a specification against the current Plot.
-
push()¶ Pushes plot updates to the frontend.
-
refresh(**kwargs)¶ Refreshes the plot by rerendering it and then pushing the updated data if the plot has an associated Comm.
-
set_root(root)¶ Sets the root model on all subplots.
-
property
state¶ The plotting state that gets updated via the update method and used by the renderer to generate output.
-
traverse(fn=None, specs=None, full_breadth=True)¶ Traverses any nested DimensionedPlot returning a list of all plots that match the specs. The specs should be supplied as a list of either Plot types or callables, which should return a boolean given the plot class.
-
update(key)¶ Update the internal state of the Plot to represent the given key tuple (where integers represent frames). Returns this state.
-
update_frame(key, ranges=None, element=None)¶ Updates an existing plot with data corresponding to the key.
-
plot Module

-
class
holoviews.plotting.plotly.plot.AdjointLayoutPlot(layout, layout_type, subplots, **params)[source]¶ Bases:
holoviews.plotting.plotly.plot.PlotlyPlot,holoviews.plotting.plot.GenericAdjointLayoutPlotParameters inherited from:
holoviews.plotting.plot.DimensionedPlot: fontsize, fontscale, show_title, title, title_format, normalize, projectionholoviews.plotting.plotly.plot.PlotlyPlot: width, height-
cleanup()¶ Cleans up references to the plot on the attached Stream subscribers.
-
compute_ranges(obj, key, ranges)¶ Given an object, a specific key, and the normalization options, this method will find the specified normalization options on the appropriate OptionTree, group the elements according to the selected normalization option (i.e. either per frame or over the whole animation) and finally compute the dimension ranges in each group. The new set of ranges is returned.
-
initialize_plot(ranges=None)[source]¶ Plot all the views contained in the AdjointLayout Object using axes appropriate to the layout configuration. All the axes are supplied by LayoutPlot - the purpose of the call is to invoke subplots with correct options and styles and hide any empty axes as necessary.
-
property
link_sources¶ Returns potential Link or Stream sources.
-
matches(spec)¶ Matches a specification against the current Plot.
-
push()¶ Pushes plot updates to the frontend.
-
refresh(**kwargs)¶ Refreshes the plot by rerendering it and then pushing the updated data if the plot has an associated Comm.
-
set_root(root)¶ Sets the root model on all subplots.
-
property
state¶ The plotting state that gets updated via the update method and used by the renderer to generate output.
-
traverse(fn=None, specs=None, full_breadth=True)¶ Traverses any nested DimensionedPlot returning a list of all plots that match the specs. The specs should be supplied as a list of either Plot types or callables, which should return a boolean given the plot class.
-
update(key)¶ Update the internal state of the Plot to represent the given key tuple (where integers represent frames). Returns this state.
-
-
class
holoviews.plotting.plotly.plot.GridPlot(layout, ranges=None, layout_num=1, **params)[source]¶ Bases:
holoviews.plotting.plotly.plot.PlotlyPlot,holoviews.plotting.plot.GenericCompositePlotPlot a group of elements in a grid layout based on a GridSpace element object.
Parameters inherited from:
holoviews.plotting.plot.DimensionedPlot: fontsize, fontscale, show_title, title, title_format, normalize, projectionholoviews.plotting.plotly.plot.PlotlyPlot: width, heighthspacing= param.Number(bounds=(0, None), default=15, inclusive_bounds=(True, True))vspacing= param.Number(bounds=(0, None), default=15, inclusive_bounds=(True, True))shared_axes= param.Boolean(bounds=(0, 1), default=True)Whether axes ranges should be shared across the layout, if disabled switches axiswise normalization option on globally.
-
cleanup()¶ Cleans up references to the plot on the attached Stream subscribers.
-
compute_ranges(obj, key, ranges)¶ Given an object, a specific key, and the normalization options, this method will find the specified normalization options on the appropriate OptionTree, group the elements according to the selected normalization option (i.e. either per frame or over the whole animation) and finally compute the dimension ranges in each group. The new set of ranges is returned.
-
initialize_plot(ranges=None)¶ Initialize the matplotlib figure.
-
property
link_sources¶ Returns potential Link or Stream sources.
-
matches(spec)¶ Matches a specification against the current Plot.
-
push()¶ Pushes plot updates to the frontend.
-
refresh(**kwargs)¶ Refreshes the plot by rerendering it and then pushing the updated data if the plot has an associated Comm.
-
set_root(root)¶ Sets the root model on all subplots.
-
property
state¶ The plotting state that gets updated via the update method and used by the renderer to generate output.
-
traverse(fn=None, specs=None, full_breadth=True)¶ Traverses any nested DimensionedPlot returning a list of all plots that match the specs. The specs should be supplied as a list of either Plot types or callables, which should return a boolean given the plot class.
-
update(key)¶ Update the internal state of the Plot to represent the given key tuple (where integers represent frames). Returns this state.
-
class
holoviews.plotting.plotly.plot.LayoutPlot(layout, **params)[source]¶ Bases:
holoviews.plotting.plotly.plot.PlotlyPlot,holoviews.plotting.plot.GenericLayoutPlotParameters inherited from:
holoviews.plotting.plot.DimensionedPlot: fontsize, fontscale, show_title, title, title_format, normalize, projectionholoviews.plotting.plot.GenericLayoutPlot: transposeholoviews.plotting.plotly.plot.PlotlyPlot: width, heighthspacing= param.Number(bounds=(0, None), default=120, inclusive_bounds=(True, True))vspacing= param.Number(bounds=(0, None), default=100, inclusive_bounds=(True, True))adjoint_spacing= param.Number(bounds=(0, None), default=20, inclusive_bounds=(True, True))shared_axes= param.Boolean(bounds=(0, 1), default=True)Whether axes ranges should be shared across the layout, if disabled switches axiswise normalization option on globally.
-
cleanup()¶ Cleans up references to the plot on the attached Stream subscribers.
-
compute_ranges(obj, key, ranges)¶ Given an object, a specific key, and the normalization options, this method will find the specified normalization options on the appropriate OptionTree, group the elements according to the selected normalization option (i.e. either per frame or over the whole animation) and finally compute the dimension ranges in each group. The new set of ranges is returned.
-
initialize_plot(ranges=None)¶ Initialize the matplotlib figure.
-
property
link_sources¶ Returns potential Link or Stream sources.
-
matches(spec)¶ Matches a specification against the current Plot.
-
push()¶ Pushes plot updates to the frontend.
-
refresh(**kwargs)¶ Refreshes the plot by rerendering it and then pushing the updated data if the plot has an associated Comm.
-
set_root(root)¶ Sets the root model on all subplots.
-
property
state¶ The plotting state that gets updated via the update method and used by the renderer to generate output.
-
traverse(fn=None, specs=None, full_breadth=True)¶ Traverses any nested DimensionedPlot returning a list of all plots that match the specs. The specs should be supplied as a list of either Plot types or callables, which should return a boolean given the plot class.
-
update(key)¶ Update the internal state of the Plot to represent the given key tuple (where integers represent frames). Returns this state.
-
class
holoviews.plotting.plotly.plot.PlotlyPlot(keys=None, dimensions=None, layout_dimensions=None, uniform=True, subplot=False, adjoined=None, layout_num=0, style=None, subplots=None, dynamic=False, **params)[source]¶ Bases:
holoviews.plotting.plot.DimensionedPlot,holoviews.plotting.plot.CallbackPlotParameters inherited from:
holoviews.plotting.plot.DimensionedPlot: fontsize, fontscale, show_title, title, title_format, normalize, projectionwidth= param.Integer(default=400, inclusive_bounds=(True, True))height= param.Integer(default=400, inclusive_bounds=(True, True))-
cleanup()¶ Cleans up references to the plot on the attached Stream subscribers.
-
compute_ranges(obj, key, ranges)¶ Given an object, a specific key, and the normalization options, this method will find the specified normalization options on the appropriate OptionTree, group the elements according to the selected normalization option (i.e. either per frame or over the whole animation) and finally compute the dimension ranges in each group. The new set of ranges is returned.
-
property
link_sources¶ Returns potential Link or Stream sources.
-
matches(spec)¶ Matches a specification against the current Plot.
-
push()¶ Pushes plot updates to the frontend.
-
refresh(**kwargs)¶ Refreshes the plot by rerendering it and then pushing the updated data if the plot has an associated Comm.
-
set_root(root)¶ Sets the root model on all subplots.
-
property
state¶ The plotting state that gets updated via the update method and used by the renderer to generate output.
-
traverse(fn=None, specs=None, full_breadth=True)¶ Traverses any nested DimensionedPlot returning a list of all plots that match the specs. The specs should be supplied as a list of either Plot types or callables, which should return a boolean given the plot class.
-
update(key)¶ Update the internal state of the Plot to represent the given key tuple (where integers represent frames). Returns this state.
-
raster Module

-
class
holoviews.plotting.plotly.raster.HeatMapPlot(element, plot=None, **params)[source]¶ Bases:
holoviews.plotting.mixins.HeatMapMixin,holoviews.plotting.plotly.raster.RasterPlotParameters inherited from:
holoviews.plotting.plot.DimensionedPlot: fontsize, fontscale, show_title, title, title_format, normalize, projectionholoviews.plotting.plot.GenericElementPlot: apply_ranges, apply_extents, default_span, hooks, finalize_hooks, show_grid, xlabel, ylabel, xlim, ylim, zlim, xrotation, yrotationholoviews.plotting.plotly.plot.PlotlyPlot: width, heightholoviews.plotting.plotly.element.ElementPlot: bgcolor, invert_axes, invert_xaxis, invert_yaxis, logx, logy, show_legend, xaxis, yaxis, xticks, yticks, aspect, invert_zaxis, labelled, logz, margins, responsive, zlabel, zticksholoviews.plotting.plotly.element.ColorbarPlot: clim, colorbar, color_levels, colorbar_opts, symmetric-
cleanup()¶ Cleans up references to the plot on the attached Stream subscribers.
-
compute_ranges(obj, key, ranges)¶ Given an object, a specific key, and the normalization options, this method will find the specified normalization options on the appropriate OptionTree, group the elements according to the selected normalization option (i.e. either per frame or over the whole animation) and finally compute the dimension ranges in each group. The new set of ranges is returned.
-
get_aspect(xspan, yspan)¶ Computes the aspect ratio of the plot
-
get_padding(obj, extents)¶ Computes padding along the axes taking into account the plot aspect.
-
get_zorder(overlay, key, el)¶ Computes the z-order of element in the NdOverlay taking into account possible batching of elements.
-
init_graph(datum, options, index=0)¶ Initialize the plotly components that will represent the element
- datum: dict
An element of the data list returned by the get_data method
- options: dict
Graph options that were returned by the graph_options method
- index: int
Index of datum in the original list returned by the get_data method
- dict
Dictionary of the plotly components that represent the element. Keys may include:
‘traces’: List of trace dicts
‘annotations’: List of annotations dicts
‘images’: List of image dicts
‘shapes’: List of shape dicts
-
initialize_plot(ranges=None)¶ Initializes a new plot object with the last available frame.
-
property
link_sources¶ Returns potential Link or Stream sources.
-
matches(spec)¶ Matches a specification against the current Plot.
-
push()¶ Pushes plot updates to the frontend.
-
refresh(**kwargs)¶ Refreshes the plot by rerendering it and then pushing the updated data if the plot has an associated Comm.
-
set_root(root)¶ Sets the root model on all subplots.
-
property
state¶ The plotting state that gets updated via the update method and used by the renderer to generate output.
-
traverse(fn=None, specs=None, full_breadth=True)¶ Traverses any nested DimensionedPlot returning a list of all plots that match the specs. The specs should be supplied as a list of either Plot types or callables, which should return a boolean given the plot class.
-
update(key)¶ Update the internal state of the Plot to represent the given key tuple (where integers represent frames). Returns this state.
-
update_frame(key, ranges=None, element=None)¶ Updates an existing plot with data corresponding to the key.
-
-
class
holoviews.plotting.plotly.raster.QuadMeshPlot(element, plot=None, **params)[source]¶ Bases:
holoviews.plotting.plotly.raster.RasterPlotParameters inherited from:
holoviews.plotting.plot.DimensionedPlot: fontsize, fontscale, show_title, title, title_format, normalize, projectionholoviews.plotting.plot.GenericElementPlot: apply_ranges, apply_extents, default_span, hooks, finalize_hooks, show_grid, xlabel, ylabel, xlim, ylim, zlim, xrotation, yrotationholoviews.plotting.plotly.plot.PlotlyPlot: width, heightholoviews.plotting.plotly.element.ElementPlot: bgcolor, invert_axes, invert_xaxis, invert_yaxis, logx, logy, show_legend, xaxis, yaxis, xticks, yticks, aspect, invert_zaxis, labelled, logz, margins, responsive, zlabel, zticksholoviews.plotting.plotly.element.ColorbarPlot: clim, colorbar, color_levels, colorbar_opts, symmetric-
cleanup()¶ Cleans up references to the plot on the attached Stream subscribers.
-
compute_ranges(obj, key, ranges)¶ Given an object, a specific key, and the normalization options, this method will find the specified normalization options on the appropriate OptionTree, group the elements according to the selected normalization option (i.e. either per frame or over the whole animation) and finally compute the dimension ranges in each group. The new set of ranges is returned.
-
get_aspect(xspan, yspan)¶ Computes the aspect ratio of the plot
-
get_extents(element, ranges, range_type='combined', xdim=None, ydim=None, zdim=None)¶ Gets the extents for the axes from the current Element. The globally computed ranges can optionally override the extents.
The extents are computed by combining the data ranges, extents and dimension ranges. Each of these can be obtained individually by setting the range_type to one of:
‘data’: Just the data ranges
‘extents’: Element.extents
‘soft’: Dimension.soft_range values
‘hard’: Dimension.range values
To obtain the combined range, which includes range padding the default may be used:
‘combined’: All the range types combined and padding applied
This allows Overlay plots to obtain each range and combine them appropriately for all the objects in the overlay.
-
get_padding(obj, extents)¶ Computes padding along the axes taking into account the plot aspect.
-
get_zorder(overlay, key, el)¶ Computes the z-order of element in the NdOverlay taking into account possible batching of elements.
-
init_graph(datum, options, index=0)¶ Initialize the plotly components that will represent the element
- datum: dict
An element of the data list returned by the get_data method
- options: dict
Graph options that were returned by the graph_options method
- index: int
Index of datum in the original list returned by the get_data method
- dict
Dictionary of the plotly components that represent the element. Keys may include:
‘traces’: List of trace dicts
‘annotations’: List of annotations dicts
‘images’: List of image dicts
‘shapes’: List of shape dicts
-
initialize_plot(ranges=None)¶ Initializes a new plot object with the last available frame.
-
property
link_sources¶ Returns potential Link or Stream sources.
-
matches(spec)¶ Matches a specification against the current Plot.
-
push()¶ Pushes plot updates to the frontend.
-
refresh(**kwargs)¶ Refreshes the plot by rerendering it and then pushing the updated data if the plot has an associated Comm.
-
set_root(root)¶ Sets the root model on all subplots.
-
property
state¶ The plotting state that gets updated via the update method and used by the renderer to generate output.
-
traverse(fn=None, specs=None, full_breadth=True)¶ Traverses any nested DimensionedPlot returning a list of all plots that match the specs. The specs should be supplied as a list of either Plot types or callables, which should return a boolean given the plot class.
-
update(key)¶ Update the internal state of the Plot to represent the given key tuple (where integers represent frames). Returns this state.
-
update_frame(key, ranges=None, element=None)¶ Updates an existing plot with data corresponding to the key.
-
-
class
holoviews.plotting.plotly.raster.RasterPlot(element, plot=None, **params)[source]¶ Bases:
holoviews.plotting.plotly.element.ColorbarPlotParameters inherited from:
holoviews.plotting.plot.DimensionedPlot: fontsize, fontscale, show_title, title, title_format, normalize, projectionholoviews.plotting.plot.GenericElementPlot: apply_ranges, apply_extents, default_span, hooks, finalize_hooks, show_grid, xlabel, ylabel, xlim, ylim, zlim, xrotation, yrotationholoviews.plotting.plotly.plot.PlotlyPlot: width, heightholoviews.plotting.plotly.element.ElementPlot: bgcolor, invert_axes, invert_xaxis, invert_yaxis, logx, logy, show_legend, xaxis, yaxis, xticks, yticks, aspect, invert_zaxis, labelled, logz, margins, responsive, zlabel, zticksholoviews.plotting.plotly.element.ColorbarPlot: clim, colorbar, color_levels, colorbar_opts, symmetricpadding= param.ClassSelector(class_=(<class ‘int’>, <class ‘float’>, <class ‘tuple’>), default=0)Fraction by which to increase auto-ranged extents to make datapoints more visible around borders. To compute padding, the axis whose screen size is largest is chosen, and the range of that axis is increased by the specified fraction along each axis. Other axes are then padded ensuring that the amount of screen space devoted to padding is equal for all axes. If specified as a tuple, the int or float values in the tuple will be used for padding in each axis, in order (x,y or x,y,z). For example, for padding=0.2 on a 800x800-pixel plot, an x-axis with the range [0,10] will be padded by 20% to be [-1,11], while a y-axis with a range [0,1000] will be padded to be [-100,1100], which should make the padding be approximately the same number of pixels. But if the same plot is changed to have a height of only 200, the y-range will then be [-400,1400] so that the y-axis padding will still match that of the x-axis. It is also possible to declare non-equal padding value for the lower and upper bound of an axis by supplying nested tuples, e.g. padding=(0.1, (0, 0.1)) will pad the x-axis lower and upper bound as well as the y-axis upper bound by a fraction of 0.1 while the y-axis lower bound is not padded at all.
-
cleanup()¶ Cleans up references to the plot on the attached Stream subscribers.
-
compute_ranges(obj, key, ranges)¶ Given an object, a specific key, and the normalization options, this method will find the specified normalization options on the appropriate OptionTree, group the elements according to the selected normalization option (i.e. either per frame or over the whole animation) and finally compute the dimension ranges in each group. The new set of ranges is returned.
-
get_aspect(xspan, yspan)¶ Computes the aspect ratio of the plot
-
get_extents(element, ranges, range_type='combined', xdim=None, ydim=None, zdim=None)¶ Gets the extents for the axes from the current Element. The globally computed ranges can optionally override the extents.
The extents are computed by combining the data ranges, extents and dimension ranges. Each of these can be obtained individually by setting the range_type to one of:
‘data’: Just the data ranges
‘extents’: Element.extents
‘soft’: Dimension.soft_range values
‘hard’: Dimension.range values
To obtain the combined range, which includes range padding the default may be used:
‘combined’: All the range types combined and padding applied
This allows Overlay plots to obtain each range and combine them appropriately for all the objects in the overlay.
-
get_padding(obj, extents)¶ Computes padding along the axes taking into account the plot aspect.
-
get_zorder(overlay, key, el)¶ Computes the z-order of element in the NdOverlay taking into account possible batching of elements.
-
init_graph(datum, options, index=0)¶ Initialize the plotly components that will represent the element
- datum: dict
An element of the data list returned by the get_data method
- options: dict
Graph options that were returned by the graph_options method
- index: int
Index of datum in the original list returned by the get_data method
- dict
Dictionary of the plotly components that represent the element. Keys may include:
‘traces’: List of trace dicts
‘annotations’: List of annotations dicts
‘images’: List of image dicts
‘shapes’: List of shape dicts
-
initialize_plot(ranges=None)¶ Initializes a new plot object with the last available frame.
-
property
link_sources¶ Returns potential Link or Stream sources.
-
matches(spec)¶ Matches a specification against the current Plot.
-
push()¶ Pushes plot updates to the frontend.
-
refresh(**kwargs)¶ Refreshes the plot by rerendering it and then pushing the updated data if the plot has an associated Comm.
-
set_root(root)¶ Sets the root model on all subplots.
-
property
state¶ The plotting state that gets updated via the update method and used by the renderer to generate output.
-
traverse(fn=None, specs=None, full_breadth=True)¶ Traverses any nested DimensionedPlot returning a list of all plots that match the specs. The specs should be supplied as a list of either Plot types or callables, which should return a boolean given the plot class.
-
update(key)¶ Update the internal state of the Plot to represent the given key tuple (where integers represent frames). Returns this state.
-
update_frame(key, ranges=None, element=None)¶ Updates an existing plot with data corresponding to the key.
renderer Module

-
class
holoviews.plotting.plotly.renderer.PlotlyRenderer(*args, **params)[source]¶ Bases:
holoviews.plotting.renderer.RendererParameters inherited from:
holoviews.plotting.renderer.Renderer: key_fn, info_fn, center, dpi, fps, mode, size, widget_location, widget_mode, css, post_render_hooksbackend= param.String(default=’plotly’)The backend name.
fig= param.ObjectSelector(default=’auto’, objects=[‘html’, ‘png’, ‘svg’, ‘auto’])Output render format for static figures. If None, no figure rendering will occur.
holomap= param.ObjectSelector(default=’auto’, objects=[‘scrubber’, ‘widgets’, ‘gif’, None, ‘auto’])Output render multi-frame (typically animated) format. If None, no multi-frame rendering will occur.
-
app(plot, show=False, new_window=False, websocket_origin=None, port=0)¶ Creates a bokeh app from a HoloViews object or plot. By default simply attaches the plot to bokeh’s curdoc and returns the Document, if show option is supplied creates an Application instance and displays it either in a browser window or inline if notebook extension has been loaded. Using the new_window option the app may be displayed in a new browser tab once the notebook extension has been loaded. A websocket origin is required when launching from an existing tornado server (such as the notebook) and it is not on the default port (‘localhost:8888’).
-
comm_manager¶ alias of
pyviz_comms.CommManager
-
components(obj, fmt=None, comm=True, **kwargs)¶ Returns data and metadata dictionaries containing HTML and JS components to include render in app, notebook, or standalone document.
-
classmethod
encode(entry)¶ Classmethod that applies conditional encoding based on mime-type. Given an entry as returned by __call__ return the data in the appropriate encoding.
-
export_widgets(obj, filename, fmt=None, template=None, json=False, json_path='', **kwargs)¶ Render and export object as a widget to a static HTML file. Allows supplying a custom template formatting string with fields to interpolate ‘js’, ‘css’ and the main ‘html’ containing the widget. Also provides options to export widget data to a json file in the supplied json_path (defaults to current path).
-
get_plot(obj, doc=None, renderer=None, comm=None, **kwargs)¶ Given a HoloViews Viewable return a corresponding plot instance.
-
get_plot_state(obj, doc=None, renderer=None, **kwargs)[source]¶ Given a HoloViews Viewable return a corresponding figure dictionary. Allows cleaning the dictionary of any internal properties that were added
-
get_size(plot)¶ Return the display size associated with a plot before rendering to any particular format. Used to generate appropriate HTML display.
Returns a tuple of (width, height) in pixels.
-
html(obj, fmt=None, css=None, resources='CDN', **kwargs)¶ Renders plot or data structure and wraps the output in HTML. The comm argument defines whether the HTML output includes code to initialize a Comm, if the plot supplies one.
-
classmethod
html_assets(core=True, extras=True, backends=None, script=False)¶ Deprecated: No longer needed
-
instance(**params)¶ Return an instance of this class, copying parameters from any existing instance provided.
-
classmethod
plot_options(obj, percent_size)[source]¶ Given an object and a percentage size (as supplied by the %output magic) return all the appropriate plot options that would be used to instantiate a plot class for that element.
Default plot sizes at the plotting class level should be taken into account.
-
classmethod
plotting_class(obj)¶ Given an object or Element class, return the suitable plotting class needed to render it with the current renderer.
-
pprint(imports=None, prefix='\n ', unknown_value='<?>', qualify=False, separator='')¶ Same as Parameterized.pprint, except that X.classname(Y is replaced with X.classname.instance(Y
-
save(obj, basename, fmt='auto', key={}, info={}, options=None, resources='inline', title=None, **kwargs)¶ Save a HoloViews object to file, either using an explicitly supplied format or to the appropriate default.
-
script_repr(imports=[], prefix=' ')¶ Same as Parameterized.script_repr, except that X.classname(Y is replaced with X.classname.instance(Y
-
server_doc(obj, doc=None)¶ Get a bokeh Document with the plot attached. May supply an existing doc, otherwise bokeh.io.curdoc() is used to attach the plot to the global document instance.
-
classmethod
state()¶ Context manager to handle global state for a backend, allowing Plot classes to temporarily override that state.
-
static_html(obj, fmt=None, template=None)¶ Generates a static HTML with the rendered object in the supplied format. Allows supplying a template formatting string with fields to interpolate ‘js’, ‘css’ and the main ‘html’.
-
classmethod
validate(options)¶ Validate an options dictionary for the renderer.
selection Module

-
class
holoviews.plotting.plotly.selection.PlotlyOverlaySelectionDisplay(color_prop='color', is_cmap=False, supports_region=True)[source]¶ Bases:
holoviews.selection.OverlaySelectionDisplayOverlay selection display subclass for use with plotly backend
shapes Module
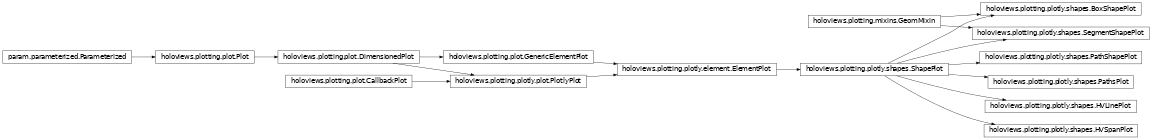
-
class
holoviews.plotting.plotly.shapes.BoxShapePlot(element, plot=None, **params)[source]¶ Bases:
holoviews.plotting.mixins.GeomMixin,holoviews.plotting.plotly.shapes.ShapePlotParameters inherited from:
holoviews.plotting.plot.DimensionedPlot: fontsize, fontscale, show_title, title, title_format, normalize, projectionholoviews.plotting.plot.GenericElementPlot: apply_ranges, apply_extents, default_span, hooks, finalize_hooks, padding, show_grid, xlabel, ylabel, xlim, ylim, zlim, xrotation, yrotationholoviews.plotting.plotly.plot.PlotlyPlot: width, heightholoviews.plotting.plotly.element.ElementPlot: bgcolor, invert_axes, invert_xaxis, invert_yaxis, logx, logy, show_legend, xaxis, yaxis, xticks, yticks, aspect, invert_zaxis, labelled, logz, margins, responsive, zlabel, zticks-
cleanup()¶ Cleans up references to the plot on the attached Stream subscribers.
-
compute_ranges(obj, key, ranges)¶ Given an object, a specific key, and the normalization options, this method will find the specified normalization options on the appropriate OptionTree, group the elements according to the selected normalization option (i.e. either per frame or over the whole animation) and finally compute the dimension ranges in each group. The new set of ranges is returned.
-
get_aspect(xspan, yspan)¶ Computes the aspect ratio of the plot
-
get_extents(element, ranges, range_type='combined')¶ Use first two key dimensions to set names, and all four to set the data range.
-
get_padding(obj, extents)¶ Computes padding along the axes taking into account the plot aspect.
-
get_zorder(overlay, key, el)¶ Computes the z-order of element in the NdOverlay taking into account possible batching of elements.
-
init_graph(datum, options, index=0)¶ Initialize the plotly components that will represent the element
- datum: dict
An element of the data list returned by the get_data method
- options: dict
Graph options that were returned by the graph_options method
- index: int
Index of datum in the original list returned by the get_data method
- dict
Dictionary of the plotly components that represent the element. Keys may include:
‘traces’: List of trace dicts
‘annotations’: List of annotations dicts
‘images’: List of image dicts
‘shapes’: List of shape dicts
-
initialize_plot(ranges=None)¶ Initializes a new plot object with the last available frame.
-
property
link_sources¶ Returns potential Link or Stream sources.
-
matches(spec)¶ Matches a specification against the current Plot.
-
push()¶ Pushes plot updates to the frontend.
-
refresh(**kwargs)¶ Refreshes the plot by rerendering it and then pushing the updated data if the plot has an associated Comm.
-
set_root(root)¶ Sets the root model on all subplots.
-
property
state¶ The plotting state that gets updated via the update method and used by the renderer to generate output.
-
traverse(fn=None, specs=None, full_breadth=True)¶ Traverses any nested DimensionedPlot returning a list of all plots that match the specs. The specs should be supplied as a list of either Plot types or callables, which should return a boolean given the plot class.
-
update(key)¶ Update the internal state of the Plot to represent the given key tuple (where integers represent frames). Returns this state.
-
update_frame(key, ranges=None, element=None)¶ Updates an existing plot with data corresponding to the key.
-
-
class
holoviews.plotting.plotly.shapes.HVLinePlot(element, plot=None, **params)[source]¶ Bases:
holoviews.plotting.plotly.shapes.ShapePlotParameters inherited from:
holoviews.plotting.plot.DimensionedPlot: fontsize, fontscale, show_title, title, title_format, normalize, projectionholoviews.plotting.plot.GenericElementPlot: apply_extents, default_span, hooks, finalize_hooks, padding, show_grid, xlabel, ylabel, xlim, ylim, zlim, xrotation, yrotationholoviews.plotting.plotly.plot.PlotlyPlot: width, heightholoviews.plotting.plotly.element.ElementPlot: bgcolor, invert_axes, invert_xaxis, invert_yaxis, logx, logy, show_legend, xaxis, yaxis, xticks, yticks, aspect, invert_zaxis, labelled, logz, margins, responsive, zlabel, zticksapply_ranges= param.Boolean(bounds=(0, 1), default=False)Whether to include the annotation in axis range calculations.
-
cleanup()¶ Cleans up references to the plot on the attached Stream subscribers.
-
compute_ranges(obj, key, ranges)¶ Given an object, a specific key, and the normalization options, this method will find the specified normalization options on the appropriate OptionTree, group the elements according to the selected normalization option (i.e. either per frame or over the whole animation) and finally compute the dimension ranges in each group. The new set of ranges is returned.
-
get_aspect(xspan, yspan)¶ Computes the aspect ratio of the plot
-
get_extents(element, ranges, range_type='combined', xdim=None, ydim=None, zdim=None)¶ Gets the extents for the axes from the current Element. The globally computed ranges can optionally override the extents.
The extents are computed by combining the data ranges, extents and dimension ranges. Each of these can be obtained individually by setting the range_type to one of:
‘data’: Just the data ranges
‘extents’: Element.extents
‘soft’: Dimension.soft_range values
‘hard’: Dimension.range values
To obtain the combined range, which includes range padding the default may be used:
‘combined’: All the range types combined and padding applied
This allows Overlay plots to obtain each range and combine them appropriately for all the objects in the overlay.
-
get_padding(obj, extents)¶ Computes padding along the axes taking into account the plot aspect.
-
get_zorder(overlay, key, el)¶ Computes the z-order of element in the NdOverlay taking into account possible batching of elements.
-
init_graph(datum, options, index=0)¶ Initialize the plotly components that will represent the element
- datum: dict
An element of the data list returned by the get_data method
- options: dict
Graph options that were returned by the graph_options method
- index: int
Index of datum in the original list returned by the get_data method
- dict
Dictionary of the plotly components that represent the element. Keys may include:
‘traces’: List of trace dicts
‘annotations’: List of annotations dicts
‘images’: List of image dicts
‘shapes’: List of shape dicts
-
initialize_plot(ranges=None)¶ Initializes a new plot object with the last available frame.
-
property
link_sources¶ Returns potential Link or Stream sources.
-
matches(spec)¶ Matches a specification against the current Plot.
-
push()¶ Pushes plot updates to the frontend.
-
refresh(**kwargs)¶ Refreshes the plot by rerendering it and then pushing the updated data if the plot has an associated Comm.
-
set_root(root)¶ Sets the root model on all subplots.
-
property
state¶ The plotting state that gets updated via the update method and used by the renderer to generate output.
-
traverse(fn=None, specs=None, full_breadth=True)¶ Traverses any nested DimensionedPlot returning a list of all plots that match the specs. The specs should be supplied as a list of either Plot types or callables, which should return a boolean given the plot class.
-
update(key)¶ Update the internal state of the Plot to represent the given key tuple (where integers represent frames). Returns this state.
-
update_frame(key, ranges=None, element=None)¶ Updates an existing plot with data corresponding to the key.
-
class
holoviews.plotting.plotly.shapes.HVSpanPlot(element, plot=None, **params)[source]¶ Bases:
holoviews.plotting.plotly.shapes.ShapePlotParameters inherited from:
holoviews.plotting.plot.DimensionedPlot: fontsize, fontscale, show_title, title, title_format, normalize, projectionholoviews.plotting.plot.GenericElementPlot: apply_extents, default_span, hooks, finalize_hooks, padding, show_grid, xlabel, ylabel, xlim, ylim, zlim, xrotation, yrotationholoviews.plotting.plotly.plot.PlotlyPlot: width, heightholoviews.plotting.plotly.element.ElementPlot: bgcolor, invert_axes, invert_xaxis, invert_yaxis, logx, logy, show_legend, xaxis, yaxis, xticks, yticks, aspect, invert_zaxis, labelled, logz, margins, responsive, zlabel, zticksapply_ranges= param.Boolean(bounds=(0, 1), default=False)Whether to include the annotation in axis range calculations.
-
cleanup()¶ Cleans up references to the plot on the attached Stream subscribers.
-
compute_ranges(obj, key, ranges)¶ Given an object, a specific key, and the normalization options, this method will find the specified normalization options on the appropriate OptionTree, group the elements according to the selected normalization option (i.e. either per frame or over the whole animation) and finally compute the dimension ranges in each group. The new set of ranges is returned.
-
get_aspect(xspan, yspan)¶ Computes the aspect ratio of the plot
-
get_extents(element, ranges, range_type='combined', xdim=None, ydim=None, zdim=None)¶ Gets the extents for the axes from the current Element. The globally computed ranges can optionally override the extents.
The extents are computed by combining the data ranges, extents and dimension ranges. Each of these can be obtained individually by setting the range_type to one of:
‘data’: Just the data ranges
‘extents’: Element.extents
‘soft’: Dimension.soft_range values
‘hard’: Dimension.range values
To obtain the combined range, which includes range padding the default may be used:
‘combined’: All the range types combined and padding applied
This allows Overlay plots to obtain each range and combine them appropriately for all the objects in the overlay.
-
get_padding(obj, extents)¶ Computes padding along the axes taking into account the plot aspect.
-
get_zorder(overlay, key, el)¶ Computes the z-order of element in the NdOverlay taking into account possible batching of elements.
-
init_graph(datum, options, index=0)¶ Initialize the plotly components that will represent the element
- datum: dict
An element of the data list returned by the get_data method
- options: dict
Graph options that were returned by the graph_options method
- index: int
Index of datum in the original list returned by the get_data method
- dict
Dictionary of the plotly components that represent the element. Keys may include:
‘traces’: List of trace dicts
‘annotations’: List of annotations dicts
‘images’: List of image dicts
‘shapes’: List of shape dicts
-
initialize_plot(ranges=None)¶ Initializes a new plot object with the last available frame.
-
property
link_sources¶ Returns potential Link or Stream sources.
-
matches(spec)¶ Matches a specification against the current Plot.
-
push()¶ Pushes plot updates to the frontend.
-
refresh(**kwargs)¶ Refreshes the plot by rerendering it and then pushing the updated data if the plot has an associated Comm.
-
set_root(root)¶ Sets the root model on all subplots.
-
property
state¶ The plotting state that gets updated via the update method and used by the renderer to generate output.
-
traverse(fn=None, specs=None, full_breadth=True)¶ Traverses any nested DimensionedPlot returning a list of all plots that match the specs. The specs should be supplied as a list of either Plot types or callables, which should return a boolean given the plot class.
-
update(key)¶ Update the internal state of the Plot to represent the given key tuple (where integers represent frames). Returns this state.
-
update_frame(key, ranges=None, element=None)¶ Updates an existing plot with data corresponding to the key.
-
class
holoviews.plotting.plotly.shapes.PathShapePlot(element, plot=None, **params)[source]¶ Bases:
holoviews.plotting.plotly.shapes.ShapePlotParameters inherited from:
holoviews.plotting.plot.DimensionedPlot: fontsize, fontscale, show_title, title, title_format, normalize, projectionholoviews.plotting.plot.GenericElementPlot: apply_ranges, apply_extents, default_span, hooks, finalize_hooks, padding, show_grid, xlabel, ylabel, xlim, ylim, zlim, xrotation, yrotationholoviews.plotting.plotly.plot.PlotlyPlot: width, heightholoviews.plotting.plotly.element.ElementPlot: bgcolor, invert_axes, invert_xaxis, invert_yaxis, logx, logy, show_legend, xaxis, yaxis, xticks, yticks, aspect, invert_zaxis, labelled, logz, margins, responsive, zlabel, zticks-
cleanup()¶ Cleans up references to the plot on the attached Stream subscribers.
-
compute_ranges(obj, key, ranges)¶ Given an object, a specific key, and the normalization options, this method will find the specified normalization options on the appropriate OptionTree, group the elements according to the selected normalization option (i.e. either per frame or over the whole animation) and finally compute the dimension ranges in each group. The new set of ranges is returned.
-
get_aspect(xspan, yspan)¶ Computes the aspect ratio of the plot
-
get_extents(element, ranges, range_type='combined', xdim=None, ydim=None, zdim=None)¶ Gets the extents for the axes from the current Element. The globally computed ranges can optionally override the extents.
The extents are computed by combining the data ranges, extents and dimension ranges. Each of these can be obtained individually by setting the range_type to one of:
‘data’: Just the data ranges
‘extents’: Element.extents
‘soft’: Dimension.soft_range values
‘hard’: Dimension.range values
To obtain the combined range, which includes range padding the default may be used:
‘combined’: All the range types combined and padding applied
This allows Overlay plots to obtain each range and combine them appropriately for all the objects in the overlay.
-
get_padding(obj, extents)¶ Computes padding along the axes taking into account the plot aspect.
-
get_zorder(overlay, key, el)¶ Computes the z-order of element in the NdOverlay taking into account possible batching of elements.
-
init_graph(datum, options, index=0)¶ Initialize the plotly components that will represent the element
- datum: dict
An element of the data list returned by the get_data method
- options: dict
Graph options that were returned by the graph_options method
- index: int
Index of datum in the original list returned by the get_data method
- dict
Dictionary of the plotly components that represent the element. Keys may include:
‘traces’: List of trace dicts
‘annotations’: List of annotations dicts
‘images’: List of image dicts
‘shapes’: List of shape dicts
-
initialize_plot(ranges=None)¶ Initializes a new plot object with the last available frame.
-
property
link_sources¶ Returns potential Link or Stream sources.
-
matches(spec)¶ Matches a specification against the current Plot.
-
push()¶ Pushes plot updates to the frontend.
-
refresh(**kwargs)¶ Refreshes the plot by rerendering it and then pushing the updated data if the plot has an associated Comm.
-
set_root(root)¶ Sets the root model on all subplots.
-
property
state¶ The plotting state that gets updated via the update method and used by the renderer to generate output.
-
traverse(fn=None, specs=None, full_breadth=True)¶ Traverses any nested DimensionedPlot returning a list of all plots that match the specs. The specs should be supplied as a list of either Plot types or callables, which should return a boolean given the plot class.
-
update(key)¶ Update the internal state of the Plot to represent the given key tuple (where integers represent frames). Returns this state.
-
update_frame(key, ranges=None, element=None)¶ Updates an existing plot with data corresponding to the key.
-
-
class
holoviews.plotting.plotly.shapes.PathsPlot(element, plot=None, **params)[source]¶ Bases:
holoviews.plotting.plotly.shapes.ShapePlotParameters inherited from:
holoviews.plotting.plot.DimensionedPlot: fontsize, fontscale, show_title, title, title_format, normalize, projectionholoviews.plotting.plot.GenericElementPlot: apply_ranges, apply_extents, default_span, hooks, finalize_hooks, padding, show_grid, xlabel, ylabel, xlim, ylim, zlim, xrotation, yrotationholoviews.plotting.plotly.plot.PlotlyPlot: width, heightholoviews.plotting.plotly.element.ElementPlot: bgcolor, invert_axes, invert_xaxis, invert_yaxis, logx, logy, show_legend, xaxis, yaxis, xticks, yticks, aspect, invert_zaxis, labelled, logz, margins, responsive, zlabel, zticks-
cleanup()¶ Cleans up references to the plot on the attached Stream subscribers.
-
compute_ranges(obj, key, ranges)¶ Given an object, a specific key, and the normalization options, this method will find the specified normalization options on the appropriate OptionTree, group the elements according to the selected normalization option (i.e. either per frame or over the whole animation) and finally compute the dimension ranges in each group. The new set of ranges is returned.
-
get_aspect(xspan, yspan)¶ Computes the aspect ratio of the plot
-
get_extents(element, ranges, range_type='combined', xdim=None, ydim=None, zdim=None)¶ Gets the extents for the axes from the current Element. The globally computed ranges can optionally override the extents.
The extents are computed by combining the data ranges, extents and dimension ranges. Each of these can be obtained individually by setting the range_type to one of:
‘data’: Just the data ranges
‘extents’: Element.extents
‘soft’: Dimension.soft_range values
‘hard’: Dimension.range values
To obtain the combined range, which includes range padding the default may be used:
‘combined’: All the range types combined and padding applied
This allows Overlay plots to obtain each range and combine them appropriately for all the objects in the overlay.
-
get_padding(obj, extents)¶ Computes padding along the axes taking into account the plot aspect.
-
get_zorder(overlay, key, el)¶ Computes the z-order of element in the NdOverlay taking into account possible batching of elements.
-
init_graph(datum, options, index=0)¶ Initialize the plotly components that will represent the element
- datum: dict
An element of the data list returned by the get_data method
- options: dict
Graph options that were returned by the graph_options method
- index: int
Index of datum in the original list returned by the get_data method
- dict
Dictionary of the plotly components that represent the element. Keys may include:
‘traces’: List of trace dicts
‘annotations’: List of annotations dicts
‘images’: List of image dicts
‘shapes’: List of shape dicts
-
initialize_plot(ranges=None)¶ Initializes a new plot object with the last available frame.
-
property
link_sources¶ Returns potential Link or Stream sources.
-
matches(spec)¶ Matches a specification against the current Plot.
-
push()¶ Pushes plot updates to the frontend.
-
refresh(**kwargs)¶ Refreshes the plot by rerendering it and then pushing the updated data if the plot has an associated Comm.
-
set_root(root)¶ Sets the root model on all subplots.
-
property
state¶ The plotting state that gets updated via the update method and used by the renderer to generate output.
-
traverse(fn=None, specs=None, full_breadth=True)¶ Traverses any nested DimensionedPlot returning a list of all plots that match the specs. The specs should be supplied as a list of either Plot types or callables, which should return a boolean given the plot class.
-
update(key)¶ Update the internal state of the Plot to represent the given key tuple (where integers represent frames). Returns this state.
-
update_frame(key, ranges=None, element=None)¶ Updates an existing plot with data corresponding to the key.
-
-
class
holoviews.plotting.plotly.shapes.SegmentShapePlot(element, plot=None, **params)[source]¶ Bases:
holoviews.plotting.mixins.GeomMixin,holoviews.plotting.plotly.shapes.ShapePlotParameters inherited from:
holoviews.plotting.plot.DimensionedPlot: fontsize, fontscale, show_title, title, title_format, normalize, projectionholoviews.plotting.plot.GenericElementPlot: apply_ranges, apply_extents, default_span, hooks, finalize_hooks, padding, show_grid, xlabel, ylabel, xlim, ylim, zlim, xrotation, yrotationholoviews.plotting.plotly.plot.PlotlyPlot: width, heightholoviews.plotting.plotly.element.ElementPlot: bgcolor, invert_axes, invert_xaxis, invert_yaxis, logx, logy, show_legend, xaxis, yaxis, xticks, yticks, aspect, invert_zaxis, labelled, logz, margins, responsive, zlabel, zticks-
cleanup()¶ Cleans up references to the plot on the attached Stream subscribers.
-
compute_ranges(obj, key, ranges)¶ Given an object, a specific key, and the normalization options, this method will find the specified normalization options on the appropriate OptionTree, group the elements according to the selected normalization option (i.e. either per frame or over the whole animation) and finally compute the dimension ranges in each group. The new set of ranges is returned.
-
get_aspect(xspan, yspan)¶ Computes the aspect ratio of the plot
-
get_extents(element, ranges, range_type='combined')¶ Use first two key dimensions to set names, and all four to set the data range.
-
get_padding(obj, extents)¶ Computes padding along the axes taking into account the plot aspect.
-
get_zorder(overlay, key, el)¶ Computes the z-order of element in the NdOverlay taking into account possible batching of elements.
-
init_graph(datum, options, index=0)¶ Initialize the plotly components that will represent the element
- datum: dict
An element of the data list returned by the get_data method
- options: dict
Graph options that were returned by the graph_options method
- index: int
Index of datum in the original list returned by the get_data method
- dict
Dictionary of the plotly components that represent the element. Keys may include:
‘traces’: List of trace dicts
‘annotations’: List of annotations dicts
‘images’: List of image dicts
‘shapes’: List of shape dicts
-
initialize_plot(ranges=None)¶ Initializes a new plot object with the last available frame.
-
property
link_sources¶ Returns potential Link or Stream sources.
-
matches(spec)¶ Matches a specification against the current Plot.
-
push()¶ Pushes plot updates to the frontend.
-
refresh(**kwargs)¶ Refreshes the plot by rerendering it and then pushing the updated data if the plot has an associated Comm.
-
set_root(root)¶ Sets the root model on all subplots.
-
property
state¶ The plotting state that gets updated via the update method and used by the renderer to generate output.
-
traverse(fn=None, specs=None, full_breadth=True)¶ Traverses any nested DimensionedPlot returning a list of all plots that match the specs. The specs should be supplied as a list of either Plot types or callables, which should return a boolean given the plot class.
-
update(key)¶ Update the internal state of the Plot to represent the given key tuple (where integers represent frames). Returns this state.
-
update_frame(key, ranges=None, element=None)¶ Updates an existing plot with data corresponding to the key.
-
-
class
holoviews.plotting.plotly.shapes.ShapePlot(element, plot=None, **params)[source]¶ Bases:
holoviews.plotting.plotly.element.ElementPlotParameters inherited from:
holoviews.plotting.plot.DimensionedPlot: fontsize, fontscale, show_title, title, title_format, normalize, projectionholoviews.plotting.plot.GenericElementPlot: apply_ranges, apply_extents, default_span, hooks, finalize_hooks, padding, show_grid, xlabel, ylabel, xlim, ylim, zlim, xrotation, yrotationholoviews.plotting.plotly.plot.PlotlyPlot: width, heightholoviews.plotting.plotly.element.ElementPlot: bgcolor, invert_axes, invert_xaxis, invert_yaxis, logx, logy, show_legend, xaxis, yaxis, xticks, yticks, aspect, invert_zaxis, labelled, logz, margins, responsive, zlabel, zticks-
cleanup()¶ Cleans up references to the plot on the attached Stream subscribers.
-
compute_ranges(obj, key, ranges)¶ Given an object, a specific key, and the normalization options, this method will find the specified normalization options on the appropriate OptionTree, group the elements according to the selected normalization option (i.e. either per frame or over the whole animation) and finally compute the dimension ranges in each group. The new set of ranges is returned.
-
get_aspect(xspan, yspan)¶ Computes the aspect ratio of the plot
-
get_extents(element, ranges, range_type='combined', xdim=None, ydim=None, zdim=None)¶ Gets the extents for the axes from the current Element. The globally computed ranges can optionally override the extents.
The extents are computed by combining the data ranges, extents and dimension ranges. Each of these can be obtained individually by setting the range_type to one of:
‘data’: Just the data ranges
‘extents’: Element.extents
‘soft’: Dimension.soft_range values
‘hard’: Dimension.range values
To obtain the combined range, which includes range padding the default may be used:
‘combined’: All the range types combined and padding applied
This allows Overlay plots to obtain each range and combine them appropriately for all the objects in the overlay.
-
get_padding(obj, extents)¶ Computes padding along the axes taking into account the plot aspect.
-
get_zorder(overlay, key, el)¶ Computes the z-order of element in the NdOverlay taking into account possible batching of elements.
-
init_graph(datum, options, index=0)[source]¶ Initialize the plotly components that will represent the element
- datum: dict
An element of the data list returned by the get_data method
- options: dict
Graph options that were returned by the graph_options method
- index: int
Index of datum in the original list returned by the get_data method
- dict
Dictionary of the plotly components that represent the element. Keys may include:
‘traces’: List of trace dicts
‘annotations’: List of annotations dicts
‘images’: List of image dicts
‘shapes’: List of shape dicts
-
initialize_plot(ranges=None)¶ Initializes a new plot object with the last available frame.
-
property
link_sources¶ Returns potential Link or Stream sources.
-
matches(spec)¶ Matches a specification against the current Plot.
-
push()¶ Pushes plot updates to the frontend.
-
refresh(**kwargs)¶ Refreshes the plot by rerendering it and then pushing the updated data if the plot has an associated Comm.
-
set_root(root)¶ Sets the root model on all subplots.
-
property
state¶ The plotting state that gets updated via the update method and used by the renderer to generate output.
-
traverse(fn=None, specs=None, full_breadth=True)¶ Traverses any nested DimensionedPlot returning a list of all plots that match the specs. The specs should be supplied as a list of either Plot types or callables, which should return a boolean given the plot class.
-
update(key)¶ Update the internal state of the Plot to represent the given key tuple (where integers represent frames). Returns this state.
-
update_frame(key, ranges=None, element=None)¶ Updates an existing plot with data corresponding to the key.
-
stats Module

-
class
holoviews.plotting.plotly.stats.BivariatePlot(element, plot=None, **params)[source]¶ Bases:
holoviews.plotting.plotly.chart.ChartPlot,holoviews.plotting.plotly.element.ColorbarPlotParameters inherited from:
holoviews.plotting.plot.DimensionedPlot: fontsize, fontscale, show_title, title, title_format, normalize, projectionholoviews.plotting.plot.GenericElementPlot: apply_ranges, apply_extents, default_span, hooks, finalize_hooks, padding, show_grid, xlabel, ylabel, xlim, ylim, zlim, xrotation, yrotationholoviews.plotting.plotly.plot.PlotlyPlot: width, heightholoviews.plotting.plotly.element.ElementPlot: bgcolor, invert_axes, invert_xaxis, invert_yaxis, logx, logy, show_legend, xaxis, yaxis, xticks, yticks, aspect, invert_zaxis, labelled, logz, margins, responsive, zlabel, zticksholoviews.plotting.plotly.element.ColorbarPlot: clim, colorbar, color_levels, colorbar_opts, symmetricfilled= param.Boolean(bounds=(0, 1), default=False)ncontours= param.Integer(inclusive_bounds=(True, True))-
cleanup()¶ Cleans up references to the plot on the attached Stream subscribers.
-
compute_ranges(obj, key, ranges)¶ Given an object, a specific key, and the normalization options, this method will find the specified normalization options on the appropriate OptionTree, group the elements according to the selected normalization option (i.e. either per frame or over the whole animation) and finally compute the dimension ranges in each group. The new set of ranges is returned.
-
get_aspect(xspan, yspan)¶ Computes the aspect ratio of the plot
-
get_extents(element, ranges, range_type='combined', xdim=None, ydim=None, zdim=None)¶ Gets the extents for the axes from the current Element. The globally computed ranges can optionally override the extents.
The extents are computed by combining the data ranges, extents and dimension ranges. Each of these can be obtained individually by setting the range_type to one of:
‘data’: Just the data ranges
‘extents’: Element.extents
‘soft’: Dimension.soft_range values
‘hard’: Dimension.range values
To obtain the combined range, which includes range padding the default may be used:
‘combined’: All the range types combined and padding applied
This allows Overlay plots to obtain each range and combine them appropriately for all the objects in the overlay.
-
get_padding(obj, extents)¶ Computes padding along the axes taking into account the plot aspect.
-
get_zorder(overlay, key, el)¶ Computes the z-order of element in the NdOverlay taking into account possible batching of elements.
-
init_graph(datum, options, index=0)¶ Initialize the plotly components that will represent the element
- datum: dict
An element of the data list returned by the get_data method
- options: dict
Graph options that were returned by the graph_options method
- index: int
Index of datum in the original list returned by the get_data method
- dict
Dictionary of the plotly components that represent the element. Keys may include:
‘traces’: List of trace dicts
‘annotations’: List of annotations dicts
‘images’: List of image dicts
‘shapes’: List of shape dicts
-
initialize_plot(ranges=None)¶ Initializes a new plot object with the last available frame.
-
property
link_sources¶ Returns potential Link or Stream sources.
-
matches(spec)¶ Matches a specification against the current Plot.
-
push()¶ Pushes plot updates to the frontend.
-
refresh(**kwargs)¶ Refreshes the plot by rerendering it and then pushing the updated data if the plot has an associated Comm.
-
set_root(root)¶ Sets the root model on all subplots.
-
property
state¶ The plotting state that gets updated via the update method and used by the renderer to generate output.
-
traverse(fn=None, specs=None, full_breadth=True)¶ Traverses any nested DimensionedPlot returning a list of all plots that match the specs. The specs should be supplied as a list of either Plot types or callables, which should return a boolean given the plot class.
-
update(key)¶ Update the internal state of the Plot to represent the given key tuple (where integers represent frames). Returns this state.
-
update_frame(key, ranges=None, element=None)¶ Updates an existing plot with data corresponding to the key.
-
-
class
holoviews.plotting.plotly.stats.BoxWhiskerPlot(element, plot=None, **params)[source]¶ Bases:
holoviews.plotting.plotly.stats.MultiDistributionPlotParameters inherited from:
holoviews.plotting.plot.DimensionedPlot: fontsize, fontscale, show_title, title, title_format, normalize, projectionholoviews.plotting.plot.GenericElementPlot: apply_ranges, apply_extents, default_span, hooks, finalize_hooks, padding, show_grid, xlabel, ylabel, xlim, ylim, zlim, xrotation, yrotationholoviews.plotting.plotly.plot.PlotlyPlot: width, heightholoviews.plotting.plotly.element.ElementPlot: bgcolor, invert_axes, invert_xaxis, invert_yaxis, logx, logy, show_legend, xaxis, yaxis, xticks, yticks, aspect, invert_zaxis, labelled, logz, margins, responsive, zlabel, zticksboxpoints= param.ObjectSelector(default=’outliers’, objects=[‘all’, ‘outliers’, ‘suspectedoutliers’, False])Which points to show, valid options are ‘all’, ‘outliers’, ‘suspectedoutliers’ and False
jitter= param.Number(default=0, inclusive_bounds=(True, True))Sets the amount of jitter in the sample points drawn. If “0”, the sample points align along the distribution axis. If “1”, the sample points are drawn in a random jitter of width equal to the width of the box(es).
mean= param.ObjectSelector(default=False, objects=[True, False, ‘sd’])If “True”, the mean of the box(es)’ underlying distribution is drawn as a dashed line inside the box(es). If “sd” the standard deviation is also drawn.
-
cleanup()¶ Cleans up references to the plot on the attached Stream subscribers.
-
compute_ranges(obj, key, ranges)¶ Given an object, a specific key, and the normalization options, this method will find the specified normalization options on the appropriate OptionTree, group the elements according to the selected normalization option (i.e. either per frame or over the whole animation) and finally compute the dimension ranges in each group. The new set of ranges is returned.
-
get_aspect(xspan, yspan)¶ Computes the aspect ratio of the plot
-
get_extents(element, ranges, range_type='combined')¶ Gets the extents for the axes from the current Element. The globally computed ranges can optionally override the extents.
The extents are computed by combining the data ranges, extents and dimension ranges. Each of these can be obtained individually by setting the range_type to one of:
‘data’: Just the data ranges
‘extents’: Element.extents
‘soft’: Dimension.soft_range values
‘hard’: Dimension.range values
To obtain the combined range, which includes range padding the default may be used:
‘combined’: All the range types combined and padding applied
This allows Overlay plots to obtain each range and combine them appropriately for all the objects in the overlay.
-
get_padding(obj, extents)¶ Computes padding along the axes taking into account the plot aspect.
-
get_zorder(overlay, key, el)¶ Computes the z-order of element in the NdOverlay taking into account possible batching of elements.
-
init_graph(datum, options, index=0)¶ Initialize the plotly components that will represent the element
- datum: dict
An element of the data list returned by the get_data method
- options: dict
Graph options that were returned by the graph_options method
- index: int
Index of datum in the original list returned by the get_data method
- dict
Dictionary of the plotly components that represent the element. Keys may include:
‘traces’: List of trace dicts
‘annotations’: List of annotations dicts
‘images’: List of image dicts
‘shapes’: List of shape dicts
-
initialize_plot(ranges=None)¶ Initializes a new plot object with the last available frame.
-
property
link_sources¶ Returns potential Link or Stream sources.
-
matches(spec)¶ Matches a specification against the current Plot.
-
push()¶ Pushes plot updates to the frontend.
-
refresh(**kwargs)¶ Refreshes the plot by rerendering it and then pushing the updated data if the plot has an associated Comm.
-
set_root(root)¶ Sets the root model on all subplots.
-
property
state¶ The plotting state that gets updated via the update method and used by the renderer to generate output.
-
traverse(fn=None, specs=None, full_breadth=True)¶ Traverses any nested DimensionedPlot returning a list of all plots that match the specs. The specs should be supplied as a list of either Plot types or callables, which should return a boolean given the plot class.
-
update(key)¶ Update the internal state of the Plot to represent the given key tuple (where integers represent frames). Returns this state.
-
update_frame(key, ranges=None, element=None)¶ Updates an existing plot with data corresponding to the key.
-
class
holoviews.plotting.plotly.stats.DistributionPlot(element, plot=None, **params)[source]¶ Bases:
holoviews.plotting.plotly.element.ElementPlotParameters inherited from:
holoviews.plotting.plot.DimensionedPlot: fontsize, fontscale, show_title, title, title_format, normalize, projectionholoviews.plotting.plot.GenericElementPlot: apply_ranges, apply_extents, default_span, hooks, finalize_hooks, padding, show_grid, xlabel, ylabel, xlim, ylim, zlim, xrotation, yrotationholoviews.plotting.plotly.plot.PlotlyPlot: width, heightholoviews.plotting.plotly.element.ElementPlot: bgcolor, invert_axes, invert_xaxis, invert_yaxis, logx, logy, show_legend, xaxis, yaxis, xticks, yticks, aspect, invert_zaxis, labelled, logz, margins, responsive, zlabel, zticksbandwidth= param.Number(inclusive_bounds=(True, True))The bandwidth of the kernel for the density estimate.
cut= param.Number(default=3, inclusive_bounds=(True, True))Draw the estimate to cut * bw from the extreme data points.
filled= param.Boolean(bounds=(0, 1), default=True)Whether the bivariate contours should be filled.
-
cleanup()¶ Cleans up references to the plot on the attached Stream subscribers.
-
compute_ranges(obj, key, ranges)¶ Given an object, a specific key, and the normalization options, this method will find the specified normalization options on the appropriate OptionTree, group the elements according to the selected normalization option (i.e. either per frame or over the whole animation) and finally compute the dimension ranges in each group. The new set of ranges is returned.
-
get_aspect(xspan, yspan)¶ Computes the aspect ratio of the plot
-
get_extents(element, ranges, range_type='combined', xdim=None, ydim=None, zdim=None)¶ Gets the extents for the axes from the current Element. The globally computed ranges can optionally override the extents.
The extents are computed by combining the data ranges, extents and dimension ranges. Each of these can be obtained individually by setting the range_type to one of:
‘data’: Just the data ranges
‘extents’: Element.extents
‘soft’: Dimension.soft_range values
‘hard’: Dimension.range values
To obtain the combined range, which includes range padding the default may be used:
‘combined’: All the range types combined and padding applied
This allows Overlay plots to obtain each range and combine them appropriately for all the objects in the overlay.
-
get_padding(obj, extents)¶ Computes padding along the axes taking into account the plot aspect.
-
get_zorder(overlay, key, el)¶ Computes the z-order of element in the NdOverlay taking into account possible batching of elements.
-
init_graph(datum, options, index=0)¶ Initialize the plotly components that will represent the element
- datum: dict
An element of the data list returned by the get_data method
- options: dict
Graph options that were returned by the graph_options method
- index: int
Index of datum in the original list returned by the get_data method
- dict
Dictionary of the plotly components that represent the element. Keys may include:
‘traces’: List of trace dicts
‘annotations’: List of annotations dicts
‘images’: List of image dicts
‘shapes’: List of shape dicts
-
initialize_plot(ranges=None)¶ Initializes a new plot object with the last available frame.
-
property
link_sources¶ Returns potential Link or Stream sources.
-
matches(spec)¶ Matches a specification against the current Plot.
-
push()¶ Pushes plot updates to the frontend.
-
refresh(**kwargs)¶ Refreshes the plot by rerendering it and then pushing the updated data if the plot has an associated Comm.
-
set_root(root)¶ Sets the root model on all subplots.
-
property
state¶ The plotting state that gets updated via the update method and used by the renderer to generate output.
-
traverse(fn=None, specs=None, full_breadth=True)¶ Traverses any nested DimensionedPlot returning a list of all plots that match the specs. The specs should be supplied as a list of either Plot types or callables, which should return a boolean given the plot class.
-
update(key)¶ Update the internal state of the Plot to represent the given key tuple (where integers represent frames). Returns this state.
-
update_frame(key, ranges=None, element=None)¶ Updates an existing plot with data corresponding to the key.
-
class
holoviews.plotting.plotly.stats.MultiDistributionPlot(element, plot=None, **params)[source]¶ Bases:
holoviews.plotting.plotly.element.ElementPlotParameters inherited from:
holoviews.plotting.plot.DimensionedPlot: fontsize, fontscale, show_title, title, title_format, normalize, projectionholoviews.plotting.plot.GenericElementPlot: apply_ranges, apply_extents, default_span, hooks, finalize_hooks, padding, show_grid, xlabel, ylabel, xlim, ylim, zlim, xrotation, yrotationholoviews.plotting.plotly.plot.PlotlyPlot: width, heightholoviews.plotting.plotly.element.ElementPlot: bgcolor, invert_axes, invert_xaxis, invert_yaxis, logx, logy, show_legend, xaxis, yaxis, xticks, yticks, aspect, invert_zaxis, labelled, logz, margins, responsive, zlabel, zticks-
cleanup()¶ Cleans up references to the plot on the attached Stream subscribers.
-
compute_ranges(obj, key, ranges)¶ Given an object, a specific key, and the normalization options, this method will find the specified normalization options on the appropriate OptionTree, group the elements according to the selected normalization option (i.e. either per frame or over the whole animation) and finally compute the dimension ranges in each group. The new set of ranges is returned.
-
get_aspect(xspan, yspan)¶ Computes the aspect ratio of the plot
-
get_extents(element, ranges, range_type='combined')[source]¶ Gets the extents for the axes from the current Element. The globally computed ranges can optionally override the extents.
The extents are computed by combining the data ranges, extents and dimension ranges. Each of these can be obtained individually by setting the range_type to one of:
‘data’: Just the data ranges
‘extents’: Element.extents
‘soft’: Dimension.soft_range values
‘hard’: Dimension.range values
To obtain the combined range, which includes range padding the default may be used:
‘combined’: All the range types combined and padding applied
This allows Overlay plots to obtain each range and combine them appropriately for all the objects in the overlay.
-
get_padding(obj, extents)¶ Computes padding along the axes taking into account the plot aspect.
-
get_zorder(overlay, key, el)¶ Computes the z-order of element in the NdOverlay taking into account possible batching of elements.
-
init_graph(datum, options, index=0)¶ Initialize the plotly components that will represent the element
- datum: dict
An element of the data list returned by the get_data method
- options: dict
Graph options that were returned by the graph_options method
- index: int
Index of datum in the original list returned by the get_data method
- dict
Dictionary of the plotly components that represent the element. Keys may include:
‘traces’: List of trace dicts
‘annotations’: List of annotations dicts
‘images’: List of image dicts
‘shapes’: List of shape dicts
-
initialize_plot(ranges=None)¶ Initializes a new plot object with the last available frame.
-
property
link_sources¶ Returns potential Link or Stream sources.
-
matches(spec)¶ Matches a specification against the current Plot.
-
push()¶ Pushes plot updates to the frontend.
-
refresh(**kwargs)¶ Refreshes the plot by rerendering it and then pushing the updated data if the plot has an associated Comm.
-
set_root(root)¶ Sets the root model on all subplots.
-
property
state¶ The plotting state that gets updated via the update method and used by the renderer to generate output.
-
traverse(fn=None, specs=None, full_breadth=True)¶ Traverses any nested DimensionedPlot returning a list of all plots that match the specs. The specs should be supplied as a list of either Plot types or callables, which should return a boolean given the plot class.
-
update(key)¶ Update the internal state of the Plot to represent the given key tuple (where integers represent frames). Returns this state.
-
update_frame(key, ranges=None, element=None)¶ Updates an existing plot with data corresponding to the key.
-
-
class
holoviews.plotting.plotly.stats.ViolinPlot(element, plot=None, **params)[source]¶ Bases:
holoviews.plotting.plotly.stats.MultiDistributionPlotParameters inherited from:
holoviews.plotting.plot.DimensionedPlot: fontsize, fontscale, show_title, title, title_format, normalize, projectionholoviews.plotting.plot.GenericElementPlot: apply_ranges, apply_extents, default_span, hooks, finalize_hooks, padding, show_grid, xlabel, ylabel, xlim, ylim, zlim, xrotation, yrotationholoviews.plotting.plotly.plot.PlotlyPlot: width, heightholoviews.plotting.plotly.element.ElementPlot: bgcolor, invert_axes, invert_xaxis, invert_yaxis, logx, logy, show_legend, xaxis, yaxis, xticks, yticks, aspect, invert_zaxis, labelled, logz, margins, responsive, zlabel, zticksbox= param.Boolean(bounds=(0, 1), default=True)Whether to draw a boxplot inside the violin
meanline= param.Boolean(bounds=(0, 1), default=False)If “True”, the mean of the box(es)’ underlying distribution is drawn as a dashed line inside the box(es). If “sd” the standard deviation is also drawn.
-
cleanup()¶ Cleans up references to the plot on the attached Stream subscribers.
-
compute_ranges(obj, key, ranges)¶ Given an object, a specific key, and the normalization options, this method will find the specified normalization options on the appropriate OptionTree, group the elements according to the selected normalization option (i.e. either per frame or over the whole animation) and finally compute the dimension ranges in each group. The new set of ranges is returned.
-
get_aspect(xspan, yspan)¶ Computes the aspect ratio of the plot
-
get_extents(element, ranges, range_type='combined')¶ Gets the extents for the axes from the current Element. The globally computed ranges can optionally override the extents.
The extents are computed by combining the data ranges, extents and dimension ranges. Each of these can be obtained individually by setting the range_type to one of:
‘data’: Just the data ranges
‘extents’: Element.extents
‘soft’: Dimension.soft_range values
‘hard’: Dimension.range values
To obtain the combined range, which includes range padding the default may be used:
‘combined’: All the range types combined and padding applied
This allows Overlay plots to obtain each range and combine them appropriately for all the objects in the overlay.
-
get_padding(obj, extents)¶ Computes padding along the axes taking into account the plot aspect.
-
get_zorder(overlay, key, el)¶ Computes the z-order of element in the NdOverlay taking into account possible batching of elements.
-
init_graph(datum, options, index=0)¶ Initialize the plotly components that will represent the element
- datum: dict
An element of the data list returned by the get_data method
- options: dict
Graph options that were returned by the graph_options method
- index: int
Index of datum in the original list returned by the get_data method
- dict
Dictionary of the plotly components that represent the element. Keys may include:
‘traces’: List of trace dicts
‘annotations’: List of annotations dicts
‘images’: List of image dicts
‘shapes’: List of shape dicts
-
initialize_plot(ranges=None)¶ Initializes a new plot object with the last available frame.
-
property
link_sources¶ Returns potential Link or Stream sources.
-
matches(spec)¶ Matches a specification against the current Plot.
-
push()¶ Pushes plot updates to the frontend.
-
refresh(**kwargs)¶ Refreshes the plot by rerendering it and then pushing the updated data if the plot has an associated Comm.
-
set_root(root)¶ Sets the root model on all subplots.
-
property
state¶ The plotting state that gets updated via the update method and used by the renderer to generate output.
-
traverse(fn=None, specs=None, full_breadth=True)¶ Traverses any nested DimensionedPlot returning a list of all plots that match the specs. The specs should be supplied as a list of either Plot types or callables, which should return a boolean given the plot class.
-
update(key)¶ Update the internal state of the Plot to represent the given key tuple (where integers represent frames). Returns this state.
-
update_frame(key, ranges=None, element=None)¶ Updates an existing plot with data corresponding to the key.
tabular Module

-
class
holoviews.plotting.plotly.tabular.TablePlot(element, plot=None, **params)[source]¶ Bases:
holoviews.plotting.plotly.element.ElementPlotParameters inherited from:
holoviews.plotting.plot.DimensionedPlot: fontsize, fontscale, show_title, title, title_format, normalize, projectionholoviews.plotting.plot.GenericElementPlot: apply_ranges, apply_extents, default_span, hooks, finalize_hooks, padding, show_grid, xlabel, ylabel, xlim, ylim, zlim, xrotation, yrotationholoviews.plotting.plotly.element.ElementPlot: bgcolor, invert_axes, invert_xaxis, invert_yaxis, logx, logy, show_legend, xaxis, yaxis, xticks, yticks, aspect, invert_zaxis, labelled, logz, margins, responsive, zlabel, ztickswidth= param.Number(default=400, inclusive_bounds=(True, True))height= param.Number(default=400, inclusive_bounds=(True, True))-
cleanup()¶ Cleans up references to the plot on the attached Stream subscribers.
-
compute_ranges(obj, key, ranges)¶ Given an object, a specific key, and the normalization options, this method will find the specified normalization options on the appropriate OptionTree, group the elements according to the selected normalization option (i.e. either per frame or over the whole animation) and finally compute the dimension ranges in each group. The new set of ranges is returned.
-
get_aspect(xspan, yspan)¶ Computes the aspect ratio of the plot
-
get_extents(element, ranges, range_type='combined', xdim=None, ydim=None, zdim=None)¶ Gets the extents for the axes from the current Element. The globally computed ranges can optionally override the extents.
The extents are computed by combining the data ranges, extents and dimension ranges. Each of these can be obtained individually by setting the range_type to one of:
‘data’: Just the data ranges
‘extents’: Element.extents
‘soft’: Dimension.soft_range values
‘hard’: Dimension.range values
To obtain the combined range, which includes range padding the default may be used:
‘combined’: All the range types combined and padding applied
This allows Overlay plots to obtain each range and combine them appropriately for all the objects in the overlay.
-
get_padding(obj, extents)¶ Computes padding along the axes taking into account the plot aspect.
-
get_zorder(overlay, key, el)¶ Computes the z-order of element in the NdOverlay taking into account possible batching of elements.
-
init_graph(datum, options, index=0)¶ Initialize the plotly components that will represent the element
- datum: dict
An element of the data list returned by the get_data method
- options: dict
Graph options that were returned by the graph_options method
- index: int
Index of datum in the original list returned by the get_data method
- dict
Dictionary of the plotly components that represent the element. Keys may include:
‘traces’: List of trace dicts
‘annotations’: List of annotations dicts
‘images’: List of image dicts
‘shapes’: List of shape dicts
-
initialize_plot(ranges=None)¶ Initializes a new plot object with the last available frame.
-
property
link_sources¶ Returns potential Link or Stream sources.
-
matches(spec)¶ Matches a specification against the current Plot.
-
push()¶ Pushes plot updates to the frontend.
-
refresh(**kwargs)¶ Refreshes the plot by rerendering it and then pushing the updated data if the plot has an associated Comm.
-
set_root(root)¶ Sets the root model on all subplots.
-
property
state¶ The plotting state that gets updated via the update method and used by the renderer to generate output.
-
traverse(fn=None, specs=None, full_breadth=True)¶ Traverses any nested DimensionedPlot returning a list of all plots that match the specs. The specs should be supplied as a list of either Plot types or callables, which should return a boolean given the plot class.
-
update(key)¶ Update the internal state of the Plot to represent the given key tuple (where integers represent frames). Returns this state.
-
update_frame(key, ranges=None, element=None)¶ Updates an existing plot with data corresponding to the key.
-
util Module
-
holoviews.plotting.plotly.util.clean_internal_figure_properties(fig)[source]¶ Remove all HoloViews internal properties (those with leading underscores) from the inupt figure.
Note: This function mutates the input figure
- fig: dict
The figure dictionary to process.
-
holoviews.plotting.plotly.util.configure_matching_axes_from_dims(fig, matching_prop='_dim')[source]¶ Configure matching axes for a figure
Note: This function mutates the input figure
- fig: dict
The figure dictionary to process.
- matching_prop: str
The name of the axis property that should be used to determine that two axes should be matched together. If the property is missing or None, axes will not be matched
-
holoviews.plotting.plotly.util.figure_grid(figures_grid, row_spacing=50, column_spacing=50, share_xaxis=False, share_yaxis=False, width=None, height=None)[source]¶ Construct a figure from a 2D grid of sub-figures
- figures_grid: list of list of (dict or None)
2D list of plotly figure dicts that will be combined in a grid to produce the resulting figure. None values maybe used to leave empty grid cells
- row_spacing: float (default 50)
Vertical spacing between rows in the gird in pixels
- column_spacing: float (default 50)
Horizontal spacing between columns in the grid in pixels coordinates
- share_xaxis: bool (default False)
Share x-axis between sub-figures in the same column. Also link all x-axes in the figure. This will only work if each sub-figure has a single x-axis
- share_yaxis: bool (default False)
Share y-axis between sub-figures in the same row. Also link all y-axes in the figure. This will only work if each subfigure has a single y-axis
- width: int (default None)
Final figure width. If not specified, width is the sum of the max width of the figures in each column
- height: int (default None)
Final figure width. If not specified, height is the sum of the max height of the figures in each row
- dict
A plotly figure dict
-
holoviews.plotting.plotly.util.get_colorscale(cmap, levels=None, cmin=None, cmax=None)[source]¶ Converts a cmap spec to a plotly colorscale
- Args:
cmap: A recognized colormap by name or list of colors levels: A list or integer declaring the color-levels cmin: The lower bound of the color range cmax: The upper bound of the color range
- Returns:
A valid plotly colorscale
-
holoviews.plotting.plotly.util.merge_figure(fig, subfig)[source]¶ Merge a sub-figure into a parent figure
Note: This function mutates the input fig dict, but it does not mutate the subfig dict
- fig: dict
The plotly figure dict into which the sub figure will be merged
- subfig: dict
The plotly figure dict that will be copied and then merged into fig