holoviews.bokeh Package
bokeh Package
annotation Module
-
class
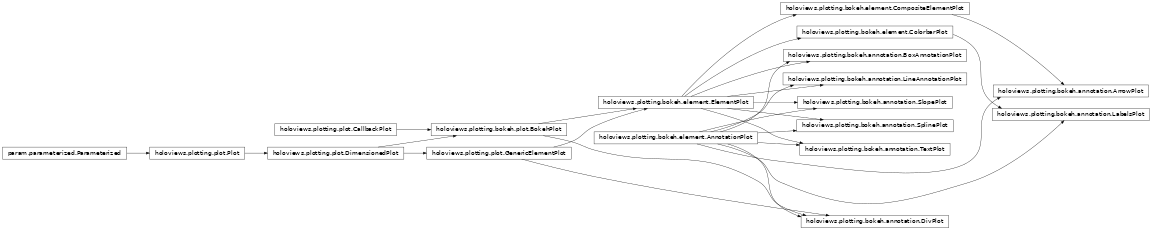
holoviews.plotting.bokeh.annotation.ArrowPlot(element, plot=None, **params)[source]¶ Bases:
holoviews.plotting.bokeh.element.CompositeElementPlot,holoviews.plotting.bokeh.element.AnnotationPlotParameters inherited from:
holoviews.plotting.plot.DimensionedPlot: fontscale, show_title, normalize, projectionholoviews.plotting.plot.GenericElementPlot: apply_ranges, apply_extents, bgcolor, default_span, hooks, invert_axes, invert_xaxis, invert_yaxis, finalize_hooks, logx, logy, padding, show_legend, show_grid, xaxis, yaxis, xlabel, ylabel, xlim, ylim, zlim, xrotation, yrotation, xticks, yticksholoviews.plotting.bokeh.plot.BokehPlot: title, title_format, shared_datasourceholoviews.plotting.bokeh.element.ElementPlot: fontsize, toolbar, width, height, active_tools, align, border, aspect, data_aspect, frame_width, frame_height, min_width, min_height, max_width, max_height, margin, responsive, gridstyle, labelled, lod, show_frame, shared_axes, default_tools, tools, xformatter, yformatter-
cleanup()¶ Cleans up references to the plot after the plot has been deleted. Traverses through all plots cleaning up Callbacks and Stream subscribers.
-
compute_ranges(obj, key, ranges)¶ Given an object, a specific key, and the normalization options, this method will find the specified normalization options on the appropriate OptionTree, group the elements according to the selected normalization option (i.e. either per frame or over the whole animation) and finally compute the dimension ranges in each group. The new set of ranges is returned.
-
property
current_handles¶ Should return a list of plot objects that have changed and should be updated.
-
property
framewise¶ Property to determine whether the current frame should have framewise normalization enabled. Required for bokeh plotting classes to determine whether to send updated ranges for each frame.
-
get_aspect(xspan, yspan)¶ Computes the aspect ratio of the plot
-
get_data(element, ranges, style)[source]¶ Returns the data from an element in the appropriate format for initializing or updating a ColumnDataSource and a dictionary which maps the expected keywords arguments of a glyph to the column in the datasource.
-
get_extents(element, ranges=None, range_type='combined')[source]¶ Gets the extents for the axes from the current Element. The globally computed ranges can optionally override the extents.
The extents are computed by combining the data ranges, extents and dimension ranges. Each of these can be obtained individually by setting the range_type to one of:
‘data’: Just the data ranges
‘extents’: Element.extents
‘soft’: Dimension.soft_range values
‘hard’: Dimension.range values
To obtain the combined range, which includes range padding the default may be used:
‘combined’: All the range types combined and padding applied
This allows Overlay plots to obtain each range and combine them appropriately for all the objects in the overlay.
-
get_padding(obj, extents)¶ Computes padding along the axes taking into account the plot aspect.
-
get_zorder(overlay, key, el)¶ Computes the z-order of element in the NdOverlay taking into account possible batching of elements.
-
initialize_plot(ranges=None, plot=None, plots=None, source=None)¶ Initializes a new plot object with the last available frame.
-
property
link_sources¶ Returns potential Link or Stream sources.
-
matches(spec)¶ Matches a specification against the current Plot.
-
model_changed(model)¶ Determines if the bokeh model was just changed on the frontend. Useful to suppress boomeranging events, e.g. when the frontend just sent an update to the x_range this should not trigger an update on the backend.
-
push()¶ Pushes plot updates to the frontend.
-
refresh(**kwargs)¶ Refreshes the plot by rerendering it and then pushing the updated data if the plot has an associated Comm.
-
set_root(root)¶ Sets the root model on all subplots.
-
property
state¶ The plotting state that gets updated via the update method and used by the renderer to generate output.
-
sync_sources()¶ Syncs data sources between Elements, which draw data from the same object.
-
traverse(fn=None, specs=None, full_breadth=True)¶ Traverses any nested DimensionedPlot returning a list of all plots that match the specs. The specs should be supplied as a list of either Plot types or callables, which should return a boolean given the plot class.
-
update(key)¶ Update the internal state of the Plot to represent the given key tuple (where integers represent frames). Returns this state.
-
update_frame(key, ranges=None, plot=None, element=None)¶ Updates an existing plot with data corresponding to the key.
-
-
class
holoviews.plotting.bokeh.annotation.BoxAnnotationPlot(element, plot=None, **params)[source]¶ Bases:
holoviews.plotting.bokeh.element.ElementPlot,holoviews.plotting.bokeh.element.AnnotationPlotParameters inherited from:
holoviews.plotting.plot.DimensionedPlot: fontscale, show_title, normalize, projectionholoviews.plotting.plot.GenericElementPlot: apply_extents, bgcolor, default_span, hooks, invert_axes, invert_xaxis, invert_yaxis, finalize_hooks, logx, logy, padding, show_legend, show_grid, xaxis, yaxis, xlabel, ylabel, xlim, ylim, zlim, xrotation, yrotation, xticks, yticksholoviews.plotting.bokeh.plot.BokehPlot: title, title_format, shared_datasourceholoviews.plotting.bokeh.element.ElementPlot: fontsize, toolbar, width, height, active_tools, align, border, aspect, data_aspect, frame_width, frame_height, min_width, min_height, max_width, max_height, margin, responsive, gridstyle, labelled, lod, show_frame, shared_axes, default_tools, tools, xformatter, yformatterapply_ranges= param.Boolean(bounds=(0, 1), default=False)Whether to include the annotation in axis range calculations.
-
cleanup()¶ Cleans up references to the plot after the plot has been deleted. Traverses through all plots cleaning up Callbacks and Stream subscribers.
-
compute_ranges(obj, key, ranges)¶ Given an object, a specific key, and the normalization options, this method will find the specified normalization options on the appropriate OptionTree, group the elements according to the selected normalization option (i.e. either per frame or over the whole animation) and finally compute the dimension ranges in each group. The new set of ranges is returned.
-
property
current_handles¶ Should return a list of plot objects that have changed and should be updated.
-
property
framewise¶ Property to determine whether the current frame should have framewise normalization enabled. Required for bokeh plotting classes to determine whether to send updated ranges for each frame.
-
get_aspect(xspan, yspan)¶ Computes the aspect ratio of the plot
-
get_data(element, ranges, style)[source]¶ Returns the data from an element in the appropriate format for initializing or updating a ColumnDataSource and a dictionary which maps the expected keywords arguments of a glyph to the column in the datasource.
-
get_extents(element, ranges, range_type='combined', xdim=None, ydim=None, zdim=None)¶ Gets the extents for the axes from the current Element. The globally computed ranges can optionally override the extents.
The extents are computed by combining the data ranges, extents and dimension ranges. Each of these can be obtained individually by setting the range_type to one of:
‘data’: Just the data ranges
‘extents’: Element.extents
‘soft’: Dimension.soft_range values
‘hard’: Dimension.range values
To obtain the combined range, which includes range padding the default may be used:
‘combined’: All the range types combined and padding applied
This allows Overlay plots to obtain each range and combine them appropriately for all the objects in the overlay.
-
get_padding(obj, extents)¶ Computes padding along the axes taking into account the plot aspect.
-
get_zorder(overlay, key, el)¶ Computes the z-order of element in the NdOverlay taking into account possible batching of elements.
-
initialize_plot(ranges=None, plot=None, plots=None, source=None)¶ Initializes a new plot object with the last available frame.
-
property
link_sources¶ Returns potential Link or Stream sources.
-
matches(spec)¶ Matches a specification against the current Plot.
-
model_changed(model)¶ Determines if the bokeh model was just changed on the frontend. Useful to suppress boomeranging events, e.g. when the frontend just sent an update to the x_range this should not trigger an update on the backend.
-
push()¶ Pushes plot updates to the frontend.
-
refresh(**kwargs)¶ Refreshes the plot by rerendering it and then pushing the updated data if the plot has an associated Comm.
-
set_root(root)¶ Sets the root model on all subplots.
-
property
state¶ The plotting state that gets updated via the update method and used by the renderer to generate output.
-
sync_sources()¶ Syncs data sources between Elements, which draw data from the same object.
-
traverse(fn=None, specs=None, full_breadth=True)¶ Traverses any nested DimensionedPlot returning a list of all plots that match the specs. The specs should be supplied as a list of either Plot types or callables, which should return a boolean given the plot class.
-
update(key)¶ Update the internal state of the Plot to represent the given key tuple (where integers represent frames). Returns this state.
-
update_frame(key, ranges=None, plot=None, element=None)¶ Updates an existing plot with data corresponding to the key.
-
class
holoviews.plotting.bokeh.annotation.DivPlot(element, plot=None, **params)[source]¶ Bases:
holoviews.plotting.bokeh.plot.BokehPlot,holoviews.plotting.plot.GenericElementPlot,holoviews.plotting.bokeh.element.AnnotationPlotParameters inherited from:
holoviews.plotting.plot.DimensionedPlot: fontsize, fontscale, show_title, normalize, projectionholoviews.plotting.plot.GenericElementPlot: apply_ranges, apply_extents, bgcolor, default_span, invert_axes, invert_xaxis, invert_yaxis, logx, logy, padding, show_legend, show_grid, xaxis, yaxis, xlabel, ylabel, xlim, ylim, zlim, xrotation, yrotation, xticks, yticksholoviews.plotting.bokeh.plot.BokehPlot: title, title_format, shared_datasource, toolbarhooks= param.HookList(bounds=(0, None), default=[])Optional list of hooks called when finalizing a plot. The hook is passed the plot object and the displayed element, and other plotting handles can be accessed via plot.handles.
finalize_hooks= param.HookList(bounds=(0, None), default=[])Deprecated; use hooks options instead.
width= param.Number(bounds=(0, None), default=300, inclusive_bounds=(True, True))The width of the component (in pixels). This can be either fixed or preferred width, depending on width sizing policy.
height= param.Number(bounds=(0, None), default=300, inclusive_bounds=(True, True))The height of the component (in pixels). This can be either fixed or preferred height, depending on height sizing policy.
sizing_mode= param.ObjectSelector(objects=[‘fixed’, ‘stretch_width’, ‘stretch_height’, ‘stretch_both’, ‘scale_width’, ‘scale_height’, ‘scale_both’, None])How the component should size itself. * “fixed” : Component is not responsive. It will retain its original width and height regardless of any subsequent browser window resize events. * “stretch_width” Component will responsively resize to stretch to the available width, without maintaining any aspect ratio. The height of the component depends on the type of the component and may be fixed or fit to component’s contents. * “stretch_height” Component will responsively resize to stretch to the available height, without maintaining any aspect ratio. The width of the component depends on the type of the component and may be fixed or fit to component’s contents. * “stretch_both” Component is completely responsive, independently in width and height, and will occupy all the available horizontal and vertical space, even if this changes the aspect ratio of the component. * “scale_width” Component will responsively resize to stretch to the available width, while maintaining the original or provided aspect ratio. * “scale_height” Component will responsively resize to stretch to the available height, while maintaining the original or provided aspect ratio. * “scale_both” Component will responsively resize to both the available width and height, while maintaining the original or provided aspect ratio.
-
cleanup()¶ Cleans up references to the plot after the plot has been deleted. Traverses through all plots cleaning up Callbacks and Stream subscribers.
-
compute_ranges(obj, key, ranges)¶ Given an object, a specific key, and the normalization options, this method will find the specified normalization options on the appropriate OptionTree, group the elements according to the selected normalization option (i.e. either per frame or over the whole animation) and finally compute the dimension ranges in each group. The new set of ranges is returned.
-
property
current_handles¶ Should return a list of plot objects that have changed and should be updated.
-
get_aspect(xspan, yspan)¶ Should define the aspect ratio of the plot.
-
get_data(element, ranges, style)[source]¶ Returns the data from an element in the appropriate format for initializing or updating a ColumnDataSource and a dictionary which maps the expected keywords arguments of a glyph to the column in the datasource.
-
get_extents(element, ranges, range_type='combined', xdim=None, ydim=None, zdim=None)¶ Gets the extents for the axes from the current Element. The globally computed ranges can optionally override the extents.
The extents are computed by combining the data ranges, extents and dimension ranges. Each of these can be obtained individually by setting the range_type to one of:
‘data’: Just the data ranges
‘extents’: Element.extents
‘soft’: Dimension.soft_range values
‘hard’: Dimension.range values
To obtain the combined range, which includes range padding the default may be used:
‘combined’: All the range types combined and padding applied
This allows Overlay plots to obtain each range and combine them appropriately for all the objects in the overlay.
-
get_padding(obj, extents)¶ Computes padding along the axes taking into account the plot aspect.
-
get_zorder(overlay, key, el)¶ Computes the z-order of element in the NdOverlay taking into account possible batching of elements.
-
initialize_plot(ranges=None, plot=None, plots=None, source=None)[source]¶ Initializes a new plot object with the last available frame.
-
property
link_sources¶ Returns potential Link or Stream sources.
-
matches(spec)¶ Matches a specification against the current Plot.
-
push()¶ Pushes plot updates to the frontend.
-
refresh(**kwargs)¶ Refreshes the plot by rerendering it and then pushing the updated data if the plot has an associated Comm.
-
set_root(root)¶ Sets the root model on all subplots.
-
property
state¶ The plotting state that gets updated via the update method and used by the renderer to generate output.
-
sync_sources()¶ Syncs data sources between Elements, which draw data from the same object.
-
traverse(fn=None, specs=None, full_breadth=True)¶ Traverses any nested DimensionedPlot returning a list of all plots that match the specs. The specs should be supplied as a list of either Plot types or callables, which should return a boolean given the plot class.
-
update(key)¶ Update the internal state of the Plot to represent the given key tuple (where integers represent frames). Returns this state.
-
class
holoviews.plotting.bokeh.annotation.LabelsPlot(element, plot=None, **params)[source]¶ Bases:
holoviews.plotting.bokeh.element.ColorbarPlot,holoviews.plotting.bokeh.element.AnnotationPlotParameters inherited from:
holoviews.plotting.plot.DimensionedPlot: fontscale, show_title, normalize, projectionholoviews.plotting.plot.GenericElementPlot: apply_ranges, apply_extents, bgcolor, default_span, hooks, invert_axes, invert_xaxis, invert_yaxis, finalize_hooks, logx, logy, padding, show_grid, xaxis, yaxis, xlabel, ylabel, xlim, ylim, zlim, xrotation, yrotation, xticks, yticksholoviews.plotting.bokeh.plot.BokehPlot: title, title_format, shared_datasourceholoviews.plotting.bokeh.element.ElementPlot: fontsize, toolbar, width, height, active_tools, align, border, aspect, data_aspect, frame_width, frame_height, min_width, min_height, max_width, max_height, margin, responsive, gridstyle, labelled, lod, show_frame, shared_axes, default_tools, tools, xformatter, yformatterholoviews.plotting.bokeh.element.ColorbarPlot: color_levels, clabel, clim, cformatter, colorbar, colorbar_position, colorbar_opts, clipping_colors, logz, symmetricshow_legend= param.Boolean(bounds=(0, 1), default=False)Whether to show legend for the plot.
xoffset= param.Number(inclusive_bounds=(True, True))Amount of offset to apply to labels along x-axis.
yoffset= param.Number(inclusive_bounds=(True, True))Amount of offset to apply to labels along x-axis.
color_index= param.ClassSelector(class_=(<class ‘str’>, <class ‘int’>))Deprecated in favor of color style mapping, e.g. color=dim(‘color’)
-
cleanup()¶ Cleans up references to the plot after the plot has been deleted. Traverses through all plots cleaning up Callbacks and Stream subscribers.
-
compute_ranges(obj, key, ranges)¶ Given an object, a specific key, and the normalization options, this method will find the specified normalization options on the appropriate OptionTree, group the elements according to the selected normalization option (i.e. either per frame or over the whole animation) and finally compute the dimension ranges in each group. The new set of ranges is returned.
-
property
current_handles¶ Should return a list of plot objects that have changed and should be updated.
-
property
framewise¶ Property to determine whether the current frame should have framewise normalization enabled. Required for bokeh plotting classes to determine whether to send updated ranges for each frame.
-
get_aspect(xspan, yspan)¶ Computes the aspect ratio of the plot
-
get_data(element, ranges, style)[source]¶ Returns the data from an element in the appropriate format for initializing or updating a ColumnDataSource and a dictionary which maps the expected keywords arguments of a glyph to the column in the datasource.
-
get_extents(element, ranges, range_type='combined', xdim=None, ydim=None, zdim=None)¶ Gets the extents for the axes from the current Element. The globally computed ranges can optionally override the extents.
The extents are computed by combining the data ranges, extents and dimension ranges. Each of these can be obtained individually by setting the range_type to one of:
‘data’: Just the data ranges
‘extents’: Element.extents
‘soft’: Dimension.soft_range values
‘hard’: Dimension.range values
To obtain the combined range, which includes range padding the default may be used:
‘combined’: All the range types combined and padding applied
This allows Overlay plots to obtain each range and combine them appropriately for all the objects in the overlay.
-
get_padding(obj, extents)¶ Computes padding along the axes taking into account the plot aspect.
-
get_zorder(overlay, key, el)¶ Computes the z-order of element in the NdOverlay taking into account possible batching of elements.
-
initialize_plot(ranges=None, plot=None, plots=None, source=None)¶ Initializes a new plot object with the last available frame.
-
property
link_sources¶ Returns potential Link or Stream sources.
-
matches(spec)¶ Matches a specification against the current Plot.
-
model_changed(model)¶ Determines if the bokeh model was just changed on the frontend. Useful to suppress boomeranging events, e.g. when the frontend just sent an update to the x_range this should not trigger an update on the backend.
-
push()¶ Pushes plot updates to the frontend.
-
refresh(**kwargs)¶ Refreshes the plot by rerendering it and then pushing the updated data if the plot has an associated Comm.
-
set_root(root)¶ Sets the root model on all subplots.
-
property
state¶ The plotting state that gets updated via the update method and used by the renderer to generate output.
-
sync_sources()¶ Syncs data sources between Elements, which draw data from the same object.
-
traverse(fn=None, specs=None, full_breadth=True)¶ Traverses any nested DimensionedPlot returning a list of all plots that match the specs. The specs should be supplied as a list of either Plot types or callables, which should return a boolean given the plot class.
-
update(key)¶ Update the internal state of the Plot to represent the given key tuple (where integers represent frames). Returns this state.
-
update_frame(key, ranges=None, plot=None, element=None)¶ Updates an existing plot with data corresponding to the key.
-
class
holoviews.plotting.bokeh.annotation.LineAnnotationPlot(element, plot=None, **params)[source]¶ Bases:
holoviews.plotting.bokeh.element.ElementPlot,holoviews.plotting.bokeh.element.AnnotationPlotParameters inherited from:
holoviews.plotting.plot.DimensionedPlot: fontscale, show_title, normalize, projectionholoviews.plotting.plot.GenericElementPlot: apply_extents, bgcolor, default_span, hooks, invert_axes, invert_xaxis, invert_yaxis, finalize_hooks, logx, logy, padding, show_legend, show_grid, xaxis, yaxis, xlabel, ylabel, xlim, ylim, zlim, xrotation, yrotation, xticks, yticksholoviews.plotting.bokeh.plot.BokehPlot: title, title_format, shared_datasourceholoviews.plotting.bokeh.element.ElementPlot: fontsize, toolbar, width, height, active_tools, align, border, aspect, data_aspect, frame_width, frame_height, min_width, min_height, max_width, max_height, margin, responsive, gridstyle, labelled, lod, show_frame, shared_axes, default_tools, tools, xformatter, yformatterapply_ranges= param.Boolean(bounds=(0, 1), default=False)Whether to include the annotation in axis range calculations.
-
cleanup()¶ Cleans up references to the plot after the plot has been deleted. Traverses through all plots cleaning up Callbacks and Stream subscribers.
-
compute_ranges(obj, key, ranges)¶ Given an object, a specific key, and the normalization options, this method will find the specified normalization options on the appropriate OptionTree, group the elements according to the selected normalization option (i.e. either per frame or over the whole animation) and finally compute the dimension ranges in each group. The new set of ranges is returned.
-
property
current_handles¶ Should return a list of plot objects that have changed and should be updated.
-
property
framewise¶ Property to determine whether the current frame should have framewise normalization enabled. Required for bokeh plotting classes to determine whether to send updated ranges for each frame.
-
get_aspect(xspan, yspan)¶ Computes the aspect ratio of the plot
-
get_data(element, ranges, style)[source]¶ Returns the data from an element in the appropriate format for initializing or updating a ColumnDataSource and a dictionary which maps the expected keywords arguments of a glyph to the column in the datasource.
-
get_extents(element, ranges=None, range_type='combined')[source]¶ Gets the extents for the axes from the current Element. The globally computed ranges can optionally override the extents.
The extents are computed by combining the data ranges, extents and dimension ranges. Each of these can be obtained individually by setting the range_type to one of:
‘data’: Just the data ranges
‘extents’: Element.extents
‘soft’: Dimension.soft_range values
‘hard’: Dimension.range values
To obtain the combined range, which includes range padding the default may be used:
‘combined’: All the range types combined and padding applied
This allows Overlay plots to obtain each range and combine them appropriately for all the objects in the overlay.
-
get_padding(obj, extents)¶ Computes padding along the axes taking into account the plot aspect.
-
get_zorder(overlay, key, el)¶ Computes the z-order of element in the NdOverlay taking into account possible batching of elements.
-
initialize_plot(ranges=None, plot=None, plots=None, source=None)¶ Initializes a new plot object with the last available frame.
-
property
link_sources¶ Returns potential Link or Stream sources.
-
matches(spec)¶ Matches a specification against the current Plot.
-
model_changed(model)¶ Determines if the bokeh model was just changed on the frontend. Useful to suppress boomeranging events, e.g. when the frontend just sent an update to the x_range this should not trigger an update on the backend.
-
push()¶ Pushes plot updates to the frontend.
-
refresh(**kwargs)¶ Refreshes the plot by rerendering it and then pushing the updated data if the plot has an associated Comm.
-
set_root(root)¶ Sets the root model on all subplots.
-
property
state¶ The plotting state that gets updated via the update method and used by the renderer to generate output.
-
sync_sources()¶ Syncs data sources between Elements, which draw data from the same object.
-
traverse(fn=None, specs=None, full_breadth=True)¶ Traverses any nested DimensionedPlot returning a list of all plots that match the specs. The specs should be supplied as a list of either Plot types or callables, which should return a boolean given the plot class.
-
update(key)¶ Update the internal state of the Plot to represent the given key tuple (where integers represent frames). Returns this state.
-
update_frame(key, ranges=None, plot=None, element=None)¶ Updates an existing plot with data corresponding to the key.
-
class
holoviews.plotting.bokeh.annotation.SlopePlot(element, plot=None, **params)[source]¶ Bases:
holoviews.plotting.bokeh.element.ElementPlot,holoviews.plotting.bokeh.element.AnnotationPlotParameters inherited from:
holoviews.plotting.plot.DimensionedPlot: fontscale, show_title, normalize, projectionholoviews.plotting.plot.GenericElementPlot: apply_ranges, apply_extents, bgcolor, default_span, hooks, invert_axes, invert_xaxis, invert_yaxis, finalize_hooks, logx, logy, padding, show_legend, show_grid, xaxis, yaxis, xlabel, ylabel, xlim, ylim, zlim, xrotation, yrotation, xticks, yticksholoviews.plotting.bokeh.plot.BokehPlot: title, title_format, shared_datasourceholoviews.plotting.bokeh.element.ElementPlot: fontsize, toolbar, width, height, active_tools, align, border, aspect, data_aspect, frame_width, frame_height, min_width, min_height, max_width, max_height, margin, responsive, gridstyle, labelled, lod, show_frame, shared_axes, default_tools, tools, xformatter, yformatter-
cleanup()¶ Cleans up references to the plot after the plot has been deleted. Traverses through all plots cleaning up Callbacks and Stream subscribers.
-
compute_ranges(obj, key, ranges)¶ Given an object, a specific key, and the normalization options, this method will find the specified normalization options on the appropriate OptionTree, group the elements according to the selected normalization option (i.e. either per frame or over the whole animation) and finally compute the dimension ranges in each group. The new set of ranges is returned.
-
property
current_handles¶ Should return a list of plot objects that have changed and should be updated.
-
property
framewise¶ Property to determine whether the current frame should have framewise normalization enabled. Required for bokeh plotting classes to determine whether to send updated ranges for each frame.
-
get_aspect(xspan, yspan)¶ Computes the aspect ratio of the plot
-
get_data(element, ranges, style)[source]¶ Returns the data from an element in the appropriate format for initializing or updating a ColumnDataSource and a dictionary which maps the expected keywords arguments of a glyph to the column in the datasource.
-
get_extents(element, ranges=None, range_type='combined')[source]¶ Gets the extents for the axes from the current Element. The globally computed ranges can optionally override the extents.
The extents are computed by combining the data ranges, extents and dimension ranges. Each of these can be obtained individually by setting the range_type to one of:
‘data’: Just the data ranges
‘extents’: Element.extents
‘soft’: Dimension.soft_range values
‘hard’: Dimension.range values
To obtain the combined range, which includes range padding the default may be used:
‘combined’: All the range types combined and padding applied
This allows Overlay plots to obtain each range and combine them appropriately for all the objects in the overlay.
-
get_padding(obj, extents)¶ Computes padding along the axes taking into account the plot aspect.
-
get_zorder(overlay, key, el)¶ Computes the z-order of element in the NdOverlay taking into account possible batching of elements.
-
initialize_plot(ranges=None, plot=None, plots=None, source=None)¶ Initializes a new plot object with the last available frame.
-
property
link_sources¶ Returns potential Link or Stream sources.
-
matches(spec)¶ Matches a specification against the current Plot.
-
model_changed(model)¶ Determines if the bokeh model was just changed on the frontend. Useful to suppress boomeranging events, e.g. when the frontend just sent an update to the x_range this should not trigger an update on the backend.
-
push()¶ Pushes plot updates to the frontend.
-
refresh(**kwargs)¶ Refreshes the plot by rerendering it and then pushing the updated data if the plot has an associated Comm.
-
set_root(root)¶ Sets the root model on all subplots.
-
property
state¶ The plotting state that gets updated via the update method and used by the renderer to generate output.
-
sync_sources()¶ Syncs data sources between Elements, which draw data from the same object.
-
traverse(fn=None, specs=None, full_breadth=True)¶ Traverses any nested DimensionedPlot returning a list of all plots that match the specs. The specs should be supplied as a list of either Plot types or callables, which should return a boolean given the plot class.
-
update(key)¶ Update the internal state of the Plot to represent the given key tuple (where integers represent frames). Returns this state.
-
update_frame(key, ranges=None, plot=None, element=None)¶ Updates an existing plot with data corresponding to the key.
-
-
class
holoviews.plotting.bokeh.annotation.SplinePlot(element, plot=None, **params)[source]¶ Bases:
holoviews.plotting.bokeh.element.ElementPlot,holoviews.plotting.bokeh.element.AnnotationPlotDraw the supplied Spline annotation (see Spline docstring). Does not support matplotlib Path codes.
Parameters inherited from:
holoviews.plotting.plot.DimensionedPlot: fontscale, show_title, normalize, projectionholoviews.plotting.plot.GenericElementPlot: apply_ranges, apply_extents, bgcolor, default_span, hooks, invert_axes, invert_xaxis, invert_yaxis, finalize_hooks, logx, logy, padding, show_legend, show_grid, xaxis, yaxis, xlabel, ylabel, xlim, ylim, zlim, xrotation, yrotation, xticks, yticksholoviews.plotting.bokeh.plot.BokehPlot: title, title_format, shared_datasourceholoviews.plotting.bokeh.element.ElementPlot: fontsize, toolbar, width, height, active_tools, align, border, aspect, data_aspect, frame_width, frame_height, min_width, min_height, max_width, max_height, margin, responsive, gridstyle, labelled, lod, show_frame, shared_axes, default_tools, tools, xformatter, yformatter-
cleanup()¶ Cleans up references to the plot after the plot has been deleted. Traverses through all plots cleaning up Callbacks and Stream subscribers.
-
compute_ranges(obj, key, ranges)¶ Given an object, a specific key, and the normalization options, this method will find the specified normalization options on the appropriate OptionTree, group the elements according to the selected normalization option (i.e. either per frame or over the whole animation) and finally compute the dimension ranges in each group. The new set of ranges is returned.
-
property
current_handles¶ Should return a list of plot objects that have changed and should be updated.
-
property
framewise¶ Property to determine whether the current frame should have framewise normalization enabled. Required for bokeh plotting classes to determine whether to send updated ranges for each frame.
-
get_aspect(xspan, yspan)¶ Computes the aspect ratio of the plot
-
get_data(element, ranges, style)[source]¶ Returns the data from an element in the appropriate format for initializing or updating a ColumnDataSource and a dictionary which maps the expected keywords arguments of a glyph to the column in the datasource.
-
get_extents(element, ranges, range_type='combined', xdim=None, ydim=None, zdim=None)¶ Gets the extents for the axes from the current Element. The globally computed ranges can optionally override the extents.
The extents are computed by combining the data ranges, extents and dimension ranges. Each of these can be obtained individually by setting the range_type to one of:
‘data’: Just the data ranges
‘extents’: Element.extents
‘soft’: Dimension.soft_range values
‘hard’: Dimension.range values
To obtain the combined range, which includes range padding the default may be used:
‘combined’: All the range types combined and padding applied
This allows Overlay plots to obtain each range and combine them appropriately for all the objects in the overlay.
-
get_padding(obj, extents)¶ Computes padding along the axes taking into account the plot aspect.
-
get_zorder(overlay, key, el)¶ Computes the z-order of element in the NdOverlay taking into account possible batching of elements.
-
initialize_plot(ranges=None, plot=None, plots=None, source=None)¶ Initializes a new plot object with the last available frame.
-
property
link_sources¶ Returns potential Link or Stream sources.
-
matches(spec)¶ Matches a specification against the current Plot.
-
model_changed(model)¶ Determines if the bokeh model was just changed on the frontend. Useful to suppress boomeranging events, e.g. when the frontend just sent an update to the x_range this should not trigger an update on the backend.
-
push()¶ Pushes plot updates to the frontend.
-
refresh(**kwargs)¶ Refreshes the plot by rerendering it and then pushing the updated data if the plot has an associated Comm.
-
set_root(root)¶ Sets the root model on all subplots.
-
property
state¶ The plotting state that gets updated via the update method and used by the renderer to generate output.
-
sync_sources()¶ Syncs data sources between Elements, which draw data from the same object.
-
traverse(fn=None, specs=None, full_breadth=True)¶ Traverses any nested DimensionedPlot returning a list of all plots that match the specs. The specs should be supplied as a list of either Plot types or callables, which should return a boolean given the plot class.
-
update(key)¶ Update the internal state of the Plot to represent the given key tuple (where integers represent frames). Returns this state.
-
update_frame(key, ranges=None, plot=None, element=None)¶ Updates an existing plot with data corresponding to the key.
-
-
class
holoviews.plotting.bokeh.annotation.TextPlot(element, plot=None, **params)[source]¶ Bases:
holoviews.plotting.bokeh.element.ElementPlot,holoviews.plotting.bokeh.element.AnnotationPlotParameters inherited from:
holoviews.plotting.plot.DimensionedPlot: fontscale, show_title, normalize, projectionholoviews.plotting.plot.GenericElementPlot: apply_ranges, apply_extents, bgcolor, default_span, hooks, invert_axes, invert_xaxis, invert_yaxis, finalize_hooks, logx, logy, padding, show_legend, show_grid, xaxis, yaxis, xlabel, ylabel, xlim, ylim, zlim, xrotation, yrotation, xticks, yticksholoviews.plotting.bokeh.plot.BokehPlot: title, title_format, shared_datasourceholoviews.plotting.bokeh.element.ElementPlot: fontsize, toolbar, width, height, active_tools, align, border, aspect, data_aspect, frame_width, frame_height, min_width, min_height, max_width, max_height, margin, responsive, gridstyle, labelled, lod, show_frame, shared_axes, default_tools, tools, xformatter, yformatter-
cleanup()¶ Cleans up references to the plot after the plot has been deleted. Traverses through all plots cleaning up Callbacks and Stream subscribers.
-
compute_ranges(obj, key, ranges)¶ Given an object, a specific key, and the normalization options, this method will find the specified normalization options on the appropriate OptionTree, group the elements according to the selected normalization option (i.e. either per frame or over the whole animation) and finally compute the dimension ranges in each group. The new set of ranges is returned.
-
property
current_handles¶ Should return a list of plot objects that have changed and should be updated.
-
property
framewise¶ Property to determine whether the current frame should have framewise normalization enabled. Required for bokeh plotting classes to determine whether to send updated ranges for each frame.
-
get_aspect(xspan, yspan)¶ Computes the aspect ratio of the plot
-
get_data(element, ranges, style)[source]¶ Returns the data from an element in the appropriate format for initializing or updating a ColumnDataSource and a dictionary which maps the expected keywords arguments of a glyph to the column in the datasource.
-
get_extents(element, ranges=None, range_type='combined')[source]¶ Gets the extents for the axes from the current Element. The globally computed ranges can optionally override the extents.
The extents are computed by combining the data ranges, extents and dimension ranges. Each of these can be obtained individually by setting the range_type to one of:
‘data’: Just the data ranges
‘extents’: Element.extents
‘soft’: Dimension.soft_range values
‘hard’: Dimension.range values
To obtain the combined range, which includes range padding the default may be used:
‘combined’: All the range types combined and padding applied
This allows Overlay plots to obtain each range and combine them appropriately for all the objects in the overlay.
-
get_padding(obj, extents)¶ Computes padding along the axes taking into account the plot aspect.
-
get_zorder(overlay, key, el)¶ Computes the z-order of element in the NdOverlay taking into account possible batching of elements.
-
initialize_plot(ranges=None, plot=None, plots=None, source=None)¶ Initializes a new plot object with the last available frame.
-
property
link_sources¶ Returns potential Link or Stream sources.
-
matches(spec)¶ Matches a specification against the current Plot.
-
model_changed(model)¶ Determines if the bokeh model was just changed on the frontend. Useful to suppress boomeranging events, e.g. when the frontend just sent an update to the x_range this should not trigger an update on the backend.
-
push()¶ Pushes plot updates to the frontend.
-
refresh(**kwargs)¶ Refreshes the plot by rerendering it and then pushing the updated data if the plot has an associated Comm.
-
set_root(root)¶ Sets the root model on all subplots.
-
property
state¶ The plotting state that gets updated via the update method and used by the renderer to generate output.
-
sync_sources()¶ Syncs data sources between Elements, which draw data from the same object.
-
traverse(fn=None, specs=None, full_breadth=True)¶ Traverses any nested DimensionedPlot returning a list of all plots that match the specs. The specs should be supplied as a list of either Plot types or callables, which should return a boolean given the plot class.
-
update(key)¶ Update the internal state of the Plot to represent the given key tuple (where integers represent frames). Returns this state.
-
update_frame(key, ranges=None, plot=None, element=None)¶ Updates an existing plot with data corresponding to the key.
-
callbacks Module
-
class
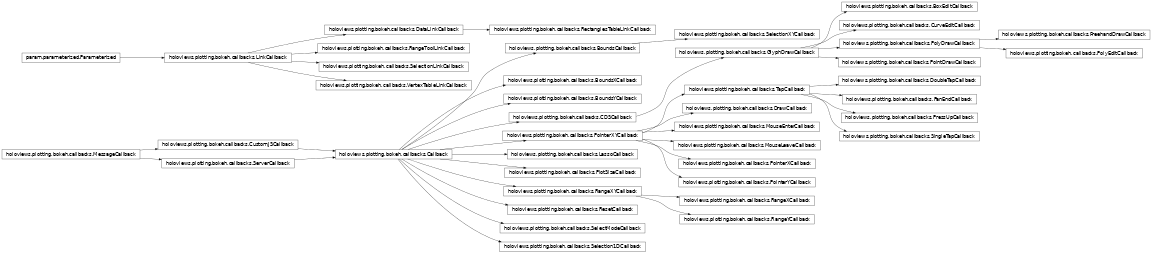
holoviews.plotting.bokeh.callbacks.BoundsCallback(plot, streams, source, **params)[source]¶ Bases:
holoviews.plotting.bokeh.callbacks.CallbackReturns the bounds of a box_select tool.
-
classmethod
attributes_js(attributes)¶ Generates JS code to look up attributes on JS objects from an attributes specification dictionary. If the specification references a plotting particular plotting handle it will also generate JS code to get the ID of the object.
Simple example (when referencing cb_data or cb_obj):
Input : {‘x’: ‘cb_data.geometry.x’}
Output : data[‘x’] = cb_data[‘geometry’][‘x’]
Example referencing plot handle:
Input : {‘x0’: ‘x_range.attributes.start’}
- Outputif ((x_range !== undefined)) {
data[‘x0’] = {id: x_range[‘id’], value: x_range[‘attributes’][‘start’]}
}
-
get_customjs(references, plot_id=None)¶ Creates a CustomJS callback that will send the requested attributes back to python.
-
on_change(attr, old, new)¶ Process change events adding timeout to process multiple concerted value change at once rather than firing off multiple plot updates.
-
on_event(event)¶ Process bokeh UIEvents adding timeout to process multiple concerted value change at once rather than firing off multiple plot updates.
-
process_on_event()¶ Trigger callback change event and triggering corresponding streams.
-
classmethod
resolve_attr_spec(spec, cb_obj, model=None)¶ Resolves a Callback attribute specification looking the corresponding attribute up on the cb_obj, which should be a bokeh model. If not model is supplied cb_obj is assumed to be the same as the model.
-
set_customjs_callback(js_callback, handle)¶ Generates a CustomJS callback by generating the required JS code and gathering all plotting handles and installs it on the requested callback handle.
-
set_server_callback(handle)¶ Set up on_change events for bokeh server interactions.
-
classmethod
-
class
holoviews.plotting.bokeh.callbacks.BoundsXCallback(plot, streams, source, **params)[source]¶ Bases:
holoviews.plotting.bokeh.callbacks.CallbackReturns the bounds of a xbox_select tool.
-
classmethod
attributes_js(attributes)¶ Generates JS code to look up attributes on JS objects from an attributes specification dictionary. If the specification references a plotting particular plotting handle it will also generate JS code to get the ID of the object.
Simple example (when referencing cb_data or cb_obj):
Input : {‘x’: ‘cb_data.geometry.x’}
Output : data[‘x’] = cb_data[‘geometry’][‘x’]
Example referencing plot handle:
Input : {‘x0’: ‘x_range.attributes.start’}
- Outputif ((x_range !== undefined)) {
data[‘x0’] = {id: x_range[‘id’], value: x_range[‘attributes’][‘start’]}
}
-
get_customjs(references, plot_id=None)¶ Creates a CustomJS callback that will send the requested attributes back to python.
-
on_change(attr, old, new)¶ Process change events adding timeout to process multiple concerted value change at once rather than firing off multiple plot updates.
-
on_event(event)¶ Process bokeh UIEvents adding timeout to process multiple concerted value change at once rather than firing off multiple plot updates.
-
process_on_event()¶ Trigger callback change event and triggering corresponding streams.
-
classmethod
resolve_attr_spec(spec, cb_obj, model=None)¶ Resolves a Callback attribute specification looking the corresponding attribute up on the cb_obj, which should be a bokeh model. If not model is supplied cb_obj is assumed to be the same as the model.
-
set_customjs_callback(js_callback, handle)¶ Generates a CustomJS callback by generating the required JS code and gathering all plotting handles and installs it on the requested callback handle.
-
set_server_callback(handle)¶ Set up on_change events for bokeh server interactions.
-
classmethod
-
class
holoviews.plotting.bokeh.callbacks.BoundsYCallback(plot, streams, source, **params)[source]¶ Bases:
holoviews.plotting.bokeh.callbacks.CallbackReturns the bounds of a ybox_select tool.
-
classmethod
attributes_js(attributes)¶ Generates JS code to look up attributes on JS objects from an attributes specification dictionary. If the specification references a plotting particular plotting handle it will also generate JS code to get the ID of the object.
Simple example (when referencing cb_data or cb_obj):
Input : {‘x’: ‘cb_data.geometry.x’}
Output : data[‘x’] = cb_data[‘geometry’][‘x’]
Example referencing plot handle:
Input : {‘x0’: ‘x_range.attributes.start’}
- Outputif ((x_range !== undefined)) {
data[‘x0’] = {id: x_range[‘id’], value: x_range[‘attributes’][‘start’]}
}
-
get_customjs(references, plot_id=None)¶ Creates a CustomJS callback that will send the requested attributes back to python.
-
on_change(attr, old, new)¶ Process change events adding timeout to process multiple concerted value change at once rather than firing off multiple plot updates.
-
on_event(event)¶ Process bokeh UIEvents adding timeout to process multiple concerted value change at once rather than firing off multiple plot updates.
-
process_on_event()¶ Trigger callback change event and triggering corresponding streams.
-
classmethod
resolve_attr_spec(spec, cb_obj, model=None)¶ Resolves a Callback attribute specification looking the corresponding attribute up on the cb_obj, which should be a bokeh model. If not model is supplied cb_obj is assumed to be the same as the model.
-
set_customjs_callback(js_callback, handle)¶ Generates a CustomJS callback by generating the required JS code and gathering all plotting handles and installs it on the requested callback handle.
-
set_server_callback(handle)¶ Set up on_change events for bokeh server interactions.
-
classmethod
-
class
holoviews.plotting.bokeh.callbacks.BoxEditCallback(plot, streams, source, **params)[source]¶ Bases:
holoviews.plotting.bokeh.callbacks.GlyphDrawCallback-
classmethod
attributes_js(attributes)¶ Generates JS code to look up attributes on JS objects from an attributes specification dictionary. If the specification references a plotting particular plotting handle it will also generate JS code to get the ID of the object.
Simple example (when referencing cb_data or cb_obj):
Input : {‘x’: ‘cb_data.geometry.x’}
Output : data[‘x’] = cb_data[‘geometry’][‘x’]
Example referencing plot handle:
Input : {‘x0’: ‘x_range.attributes.start’}
- Outputif ((x_range !== undefined)) {
data[‘x0’] = {id: x_range[‘id’], value: x_range[‘attributes’][‘start’]}
}
-
get_customjs(references, plot_id=None)¶ Creates a CustomJS callback that will send the requested attributes back to python.
-
on_change(attr, old, new)¶ Process change events adding timeout to process multiple concerted value change at once rather than firing off multiple plot updates.
-
on_event(event)¶ Process bokeh UIEvents adding timeout to process multiple concerted value change at once rather than firing off multiple plot updates.
-
process_on_event()¶ Trigger callback change event and triggering corresponding streams.
-
classmethod
resolve_attr_spec(spec, cb_obj, model=None)¶ Resolves a Callback attribute specification looking the corresponding attribute up on the cb_obj, which should be a bokeh model. If not model is supplied cb_obj is assumed to be the same as the model.
-
set_customjs_callback(js_callback, handle)¶ Generates a CustomJS callback by generating the required JS code and gathering all plotting handles and installs it on the requested callback handle.
-
set_server_callback(handle)¶ Set up on_change events for bokeh server interactions.
-
classmethod
-
class
holoviews.plotting.bokeh.callbacks.CDSCallback(plot, streams, source, **params)[source]¶ Bases:
holoviews.plotting.bokeh.callbacks.CallbackA Stream callback that syncs the data on a bokeh ColumnDataSource model with Python.
-
classmethod
attributes_js(attributes)¶ Generates JS code to look up attributes on JS objects from an attributes specification dictionary. If the specification references a plotting particular plotting handle it will also generate JS code to get the ID of the object.
Simple example (when referencing cb_data or cb_obj):
Input : {‘x’: ‘cb_data.geometry.x’}
Output : data[‘x’] = cb_data[‘geometry’][‘x’]
Example referencing plot handle:
Input : {‘x0’: ‘x_range.attributes.start’}
- Outputif ((x_range !== undefined)) {
data[‘x0’] = {id: x_range[‘id’], value: x_range[‘attributes’][‘start’]}
}
-
get_customjs(references, plot_id=None)¶ Creates a CustomJS callback that will send the requested attributes back to python.
-
on_change(attr, old, new)¶ Process change events adding timeout to process multiple concerted value change at once rather than firing off multiple plot updates.
-
on_event(event)¶ Process bokeh UIEvents adding timeout to process multiple concerted value change at once rather than firing off multiple plot updates.
-
process_on_event()¶ Trigger callback change event and triggering corresponding streams.
-
classmethod
resolve_attr_spec(spec, cb_obj, model=None)¶ Resolves a Callback attribute specification looking the corresponding attribute up on the cb_obj, which should be a bokeh model. If not model is supplied cb_obj is assumed to be the same as the model.
-
set_customjs_callback(js_callback, handle)¶ Generates a CustomJS callback by generating the required JS code and gathering all plotting handles and installs it on the requested callback handle.
-
set_server_callback(handle)¶ Set up on_change events for bokeh server interactions.
-
classmethod
-
class
holoviews.plotting.bokeh.callbacks.Callback(plot, streams, source, **params)[source]¶ Bases:
holoviews.plotting.bokeh.callbacks.CustomJSCallback,holoviews.plotting.bokeh.callbacks.ServerCallbackProvides a baseclass to define callbacks, which return data from bokeh model callbacks, events and attribute changes. The callback then makes this data available to any streams attached to it.
The definition of a callback consists of a number of components:
- modelsDefines which bokeh models the callback will be
attached on referencing the model by its key in the plots handles, e.g. this could be the x_range, y_range, plot, a plotting tool or any other bokeh mode.
- extra_models: Any additional models available in handles which
should be made available in the namespace of the objects, e.g. to make a tool available to skip checks.
- attributesThe attributes define which attributes to send
back to Python. They are defined as a dictionary mapping between the name under which the variable is made available to Python and the specification of the attribute. The specification should start with the variable name that is to be accessed and the location of the attribute separated by periods. All models defined by the models and extra_models attributes can be addressed in this way, e.g. to get the start of the x_range as ‘x’ you can supply {‘x’: ‘x_range.attributes.start’}. Additionally certain handles additionally make the cb_data and cb_obj variables available containing additional information about the event.
- skipConditions when the Callback should be skipped
specified as a list of valid JS expressions, which can reference models requested by the callback, e.g. [‘pan.attributes.active’] would skip the callback if the pan tool is active.
- codeDefines any additional JS code to be executed,
which can modify the data object that is sent to the backend.
- on_eventsIf the Callback should listen to bokeh events this
should declare the types of event as a list (optional)
- on_changesIf the Callback should listen to model attribute
changes on the defined
models(optional)
If either on_events or on_changes are declared the Callback will be registered using the on_event or on_change machinery, otherwise it will be treated as a regular callback on the model. The callback can also define a _process_msg method, which can modify the data sent by the callback before it is passed to the streams.
-
classmethod
attributes_js(attributes)¶ Generates JS code to look up attributes on JS objects from an attributes specification dictionary. If the specification references a plotting particular plotting handle it will also generate JS code to get the ID of the object.
Simple example (when referencing cb_data or cb_obj):
Input : {‘x’: ‘cb_data.geometry.x’}
Output : data[‘x’] = cb_data[‘geometry’][‘x’]
Example referencing plot handle:
Input : {‘x0’: ‘x_range.attributes.start’}
- Outputif ((x_range !== undefined)) {
data[‘x0’] = {id: x_range[‘id’], value: x_range[‘attributes’][‘start’]}
}
-
get_customjs(references, plot_id=None)¶ Creates a CustomJS callback that will send the requested attributes back to python.
-
on_change(attr, old, new)¶ Process change events adding timeout to process multiple concerted value change at once rather than firing off multiple plot updates.
-
on_event(event)¶ Process bokeh UIEvents adding timeout to process multiple concerted value change at once rather than firing off multiple plot updates.
-
process_on_event()¶ Trigger callback change event and triggering corresponding streams.
-
classmethod
resolve_attr_spec(spec, cb_obj, model=None)¶ Resolves a Callback attribute specification looking the corresponding attribute up on the cb_obj, which should be a bokeh model. If not model is supplied cb_obj is assumed to be the same as the model.
-
set_customjs_callback(js_callback, handle)¶ Generates a CustomJS callback by generating the required JS code and gathering all plotting handles and installs it on the requested callback handle.
-
set_server_callback(handle)¶ Set up on_change events for bokeh server interactions.
-
class
holoviews.plotting.bokeh.callbacks.CurveEditCallback(plot, streams, source, **params)[source]¶ Bases:
holoviews.plotting.bokeh.callbacks.GlyphDrawCallback-
classmethod
attributes_js(attributes)¶ Generates JS code to look up attributes on JS objects from an attributes specification dictionary. If the specification references a plotting particular plotting handle it will also generate JS code to get the ID of the object.
Simple example (when referencing cb_data or cb_obj):
Input : {‘x’: ‘cb_data.geometry.x’}
Output : data[‘x’] = cb_data[‘geometry’][‘x’]
Example referencing plot handle:
Input : {‘x0’: ‘x_range.attributes.start’}
- Outputif ((x_range !== undefined)) {
data[‘x0’] = {id: x_range[‘id’], value: x_range[‘attributes’][‘start’]}
}
-
get_customjs(references, plot_id=None)¶ Creates a CustomJS callback that will send the requested attributes back to python.
-
on_change(attr, old, new)¶ Process change events adding timeout to process multiple concerted value change at once rather than firing off multiple plot updates.
-
on_event(event)¶ Process bokeh UIEvents adding timeout to process multiple concerted value change at once rather than firing off multiple plot updates.
-
process_on_event()¶ Trigger callback change event and triggering corresponding streams.
-
classmethod
resolve_attr_spec(spec, cb_obj, model=None)¶ Resolves a Callback attribute specification looking the corresponding attribute up on the cb_obj, which should be a bokeh model. If not model is supplied cb_obj is assumed to be the same as the model.
-
set_customjs_callback(js_callback, handle)¶ Generates a CustomJS callback by generating the required JS code and gathering all plotting handles and installs it on the requested callback handle.
-
set_server_callback(handle)¶ Set up on_change events for bokeh server interactions.
-
classmethod
-
class
holoviews.plotting.bokeh.callbacks.CustomJSCallback(plot, streams, source, **params)[source]¶ Bases:
holoviews.plotting.bokeh.callbacks.MessageCallbackThe CustomJSCallback attaches CustomJS callbacks to a bokeh plot, which looks up the requested attributes and sends back a message to Python using a Comms instance.
-
classmethod
attributes_js(attributes)[source]¶ Generates JS code to look up attributes on JS objects from an attributes specification dictionary. If the specification references a plotting particular plotting handle it will also generate JS code to get the ID of the object.
Simple example (when referencing cb_data or cb_obj):
Input : {‘x’: ‘cb_data.geometry.x’}
Output : data[‘x’] = cb_data[‘geometry’][‘x’]
Example referencing plot handle:
Input : {‘x0’: ‘x_range.attributes.start’}
- Outputif ((x_range !== undefined)) {
data[‘x0’] = {id: x_range[‘id’], value: x_range[‘attributes’][‘start’]}
}
-
classmethod
-
class
holoviews.plotting.bokeh.callbacks.DataLinkCallback(root_model, link, source_plot, target_plot)[source]¶ Bases:
holoviews.plotting.bokeh.callbacks.LinkCallbackMerges the source and target ColumnDataSource
-
classmethod
find_link(plot, link=None)¶ Searches a GenericElementPlot for a Link.
-
classmethod
find_links(root_plot)¶ Traverses the supplied plot and searches for any Links on the plotted objects.
-
validate()¶ Should be subclassed to check if the source and target plots are compatible to perform the linking.
-
classmethod
-
class
holoviews.plotting.bokeh.callbacks.DoubleTapCallback(plot, streams, source, **params)[source]¶ Bases:
holoviews.plotting.bokeh.callbacks.TapCallbackReturns the mouse x/y-position on doubletap event.
-
classmethod
attributes_js(attributes)¶ Generates JS code to look up attributes on JS objects from an attributes specification dictionary. If the specification references a plotting particular plotting handle it will also generate JS code to get the ID of the object.
Simple example (when referencing cb_data or cb_obj):
Input : {‘x’: ‘cb_data.geometry.x’}
Output : data[‘x’] = cb_data[‘geometry’][‘x’]
Example referencing plot handle:
Input : {‘x0’: ‘x_range.attributes.start’}
- Outputif ((x_range !== undefined)) {
data[‘x0’] = {id: x_range[‘id’], value: x_range[‘attributes’][‘start’]}
}
-
get_customjs(references, plot_id=None)¶ Creates a CustomJS callback that will send the requested attributes back to python.
-
on_change(attr, old, new)¶ Process change events adding timeout to process multiple concerted value change at once rather than firing off multiple plot updates.
-
on_event(event)¶ Process bokeh UIEvents adding timeout to process multiple concerted value change at once rather than firing off multiple plot updates.
-
process_on_event()¶ Trigger callback change event and triggering corresponding streams.
-
classmethod
resolve_attr_spec(spec, cb_obj, model=None)¶ Resolves a Callback attribute specification looking the corresponding attribute up on the cb_obj, which should be a bokeh model. If not model is supplied cb_obj is assumed to be the same as the model.
-
set_customjs_callback(js_callback, handle)¶ Generates a CustomJS callback by generating the required JS code and gathering all plotting handles and installs it on the requested callback handle.
-
set_server_callback(handle)¶ Set up on_change events for bokeh server interactions.
-
classmethod
-
class
holoviews.plotting.bokeh.callbacks.DrawCallback(*args, **kwargs)[source]¶ Bases:
holoviews.plotting.bokeh.callbacks.PointerXYCallback-
classmethod
attributes_js(attributes)¶ Generates JS code to look up attributes on JS objects from an attributes specification dictionary. If the specification references a plotting particular plotting handle it will also generate JS code to get the ID of the object.
Simple example (when referencing cb_data or cb_obj):
Input : {‘x’: ‘cb_data.geometry.x’}
Output : data[‘x’] = cb_data[‘geometry’][‘x’]
Example referencing plot handle:
Input : {‘x0’: ‘x_range.attributes.start’}
- Outputif ((x_range !== undefined)) {
data[‘x0’] = {id: x_range[‘id’], value: x_range[‘attributes’][‘start’]}
}
-
get_customjs(references, plot_id=None)¶ Creates a CustomJS callback that will send the requested attributes back to python.
-
on_change(attr, old, new)¶ Process change events adding timeout to process multiple concerted value change at once rather than firing off multiple plot updates.
-
on_event(event)¶ Process bokeh UIEvents adding timeout to process multiple concerted value change at once rather than firing off multiple plot updates.
-
process_on_event()¶ Trigger callback change event and triggering corresponding streams.
-
classmethod
resolve_attr_spec(spec, cb_obj, model=None)¶ Resolves a Callback attribute specification looking the corresponding attribute up on the cb_obj, which should be a bokeh model. If not model is supplied cb_obj is assumed to be the same as the model.
-
set_customjs_callback(js_callback, handle)¶ Generates a CustomJS callback by generating the required JS code and gathering all plotting handles and installs it on the requested callback handle.
-
set_server_callback(handle)¶ Set up on_change events for bokeh server interactions.
-
classmethod
-
class
holoviews.plotting.bokeh.callbacks.FreehandDrawCallback(plot, streams, source, **params)[source]¶ Bases:
holoviews.plotting.bokeh.callbacks.PolyDrawCallback-
classmethod
attributes_js(attributes)¶ Generates JS code to look up attributes on JS objects from an attributes specification dictionary. If the specification references a plotting particular plotting handle it will also generate JS code to get the ID of the object.
Simple example (when referencing cb_data or cb_obj):
Input : {‘x’: ‘cb_data.geometry.x’}
Output : data[‘x’] = cb_data[‘geometry’][‘x’]
Example referencing plot handle:
Input : {‘x0’: ‘x_range.attributes.start’}
- Outputif ((x_range !== undefined)) {
data[‘x0’] = {id: x_range[‘id’], value: x_range[‘attributes’][‘start’]}
}
-
get_customjs(references, plot_id=None)¶ Creates a CustomJS callback that will send the requested attributes back to python.
-
on_change(attr, old, new)¶ Process change events adding timeout to process multiple concerted value change at once rather than firing off multiple plot updates.
-
on_event(event)¶ Process bokeh UIEvents adding timeout to process multiple concerted value change at once rather than firing off multiple plot updates.
-
process_on_event()¶ Trigger callback change event and triggering corresponding streams.
-
classmethod
resolve_attr_spec(spec, cb_obj, model=None)¶ Resolves a Callback attribute specification looking the corresponding attribute up on the cb_obj, which should be a bokeh model. If not model is supplied cb_obj is assumed to be the same as the model.
-
set_customjs_callback(js_callback, handle)¶ Generates a CustomJS callback by generating the required JS code and gathering all plotting handles and installs it on the requested callback handle.
-
set_server_callback(handle)¶ Set up on_change events for bokeh server interactions.
-
classmethod
-
class
holoviews.plotting.bokeh.callbacks.GlyphDrawCallback(plot, streams, source, **params)[source]¶ Bases:
holoviews.plotting.bokeh.callbacks.CDSCallback-
classmethod
attributes_js(attributes)¶ Generates JS code to look up attributes on JS objects from an attributes specification dictionary. If the specification references a plotting particular plotting handle it will also generate JS code to get the ID of the object.
Simple example (when referencing cb_data or cb_obj):
Input : {‘x’: ‘cb_data.geometry.x’}
Output : data[‘x’] = cb_data[‘geometry’][‘x’]
Example referencing plot handle:
Input : {‘x0’: ‘x_range.attributes.start’}
- Outputif ((x_range !== undefined)) {
data[‘x0’] = {id: x_range[‘id’], value: x_range[‘attributes’][‘start’]}
}
-
get_customjs(references, plot_id=None)¶ Creates a CustomJS callback that will send the requested attributes back to python.
-
on_change(attr, old, new)¶ Process change events adding timeout to process multiple concerted value change at once rather than firing off multiple plot updates.
-
on_event(event)¶ Process bokeh UIEvents adding timeout to process multiple concerted value change at once rather than firing off multiple plot updates.
-
process_on_event()¶ Trigger callback change event and triggering corresponding streams.
-
classmethod
resolve_attr_spec(spec, cb_obj, model=None)¶ Resolves a Callback attribute specification looking the corresponding attribute up on the cb_obj, which should be a bokeh model. If not model is supplied cb_obj is assumed to be the same as the model.
-
set_customjs_callback(js_callback, handle)¶ Generates a CustomJS callback by generating the required JS code and gathering all plotting handles and installs it on the requested callback handle.
-
set_server_callback(handle)¶ Set up on_change events for bokeh server interactions.
-
classmethod
-
class
holoviews.plotting.bokeh.callbacks.LassoCallback(plot, streams, source, **params)[source]¶ Bases:
holoviews.plotting.bokeh.callbacks.Callback-
classmethod
attributes_js(attributes)¶ Generates JS code to look up attributes on JS objects from an attributes specification dictionary. If the specification references a plotting particular plotting handle it will also generate JS code to get the ID of the object.
Simple example (when referencing cb_data or cb_obj):
Input : {‘x’: ‘cb_data.geometry.x’}
Output : data[‘x’] = cb_data[‘geometry’][‘x’]
Example referencing plot handle:
Input : {‘x0’: ‘x_range.attributes.start’}
- Outputif ((x_range !== undefined)) {
data[‘x0’] = {id: x_range[‘id’], value: x_range[‘attributes’][‘start’]}
}
-
get_customjs(references, plot_id=None)¶ Creates a CustomJS callback that will send the requested attributes back to python.
-
on_change(attr, old, new)¶ Process change events adding timeout to process multiple concerted value change at once rather than firing off multiple plot updates.
-
on_event(event)¶ Process bokeh UIEvents adding timeout to process multiple concerted value change at once rather than firing off multiple plot updates.
-
process_on_event()¶ Trigger callback change event and triggering corresponding streams.
-
classmethod
resolve_attr_spec(spec, cb_obj, model=None)¶ Resolves a Callback attribute specification looking the corresponding attribute up on the cb_obj, which should be a bokeh model. If not model is supplied cb_obj is assumed to be the same as the model.
-
set_customjs_callback(js_callback, handle)¶ Generates a CustomJS callback by generating the required JS code and gathering all plotting handles and installs it on the requested callback handle.
-
set_server_callback(handle)¶ Set up on_change events for bokeh server interactions.
-
classmethod
-
class
holoviews.plotting.bokeh.callbacks.LinkCallback(root_model, link, source_plot, target_plot=None)[source]¶ Bases:
param.parameterized.Parameterized
-
class
holoviews.plotting.bokeh.callbacks.MessageCallback(plot, streams, source, **params)[source]¶ Bases:
objectA MessageCallback is an abstract baseclass used to supply Streams with events originating from bokeh plot interactions. The baseclass defines how messages are handled and the basic specification required to define a Callback.
-
class
holoviews.plotting.bokeh.callbacks.MouseEnterCallback(plot, streams, source, **params)[source]¶ Bases:
holoviews.plotting.bokeh.callbacks.PointerXYCallbackReturns the mouse x/y-position on mouseenter event, i.e. when mouse enters the plot canvas.
-
classmethod
attributes_js(attributes)¶ Generates JS code to look up attributes on JS objects from an attributes specification dictionary. If the specification references a plotting particular plotting handle it will also generate JS code to get the ID of the object.
Simple example (when referencing cb_data or cb_obj):
Input : {‘x’: ‘cb_data.geometry.x’}
Output : data[‘x’] = cb_data[‘geometry’][‘x’]
Example referencing plot handle:
Input : {‘x0’: ‘x_range.attributes.start’}
- Outputif ((x_range !== undefined)) {
data[‘x0’] = {id: x_range[‘id’], value: x_range[‘attributes’][‘start’]}
}
-
get_customjs(references, plot_id=None)¶ Creates a CustomJS callback that will send the requested attributes back to python.
-
on_change(attr, old, new)¶ Process change events adding timeout to process multiple concerted value change at once rather than firing off multiple plot updates.
-
on_event(event)¶ Process bokeh UIEvents adding timeout to process multiple concerted value change at once rather than firing off multiple plot updates.
-
process_on_event()¶ Trigger callback change event and triggering corresponding streams.
-
classmethod
resolve_attr_spec(spec, cb_obj, model=None)¶ Resolves a Callback attribute specification looking the corresponding attribute up on the cb_obj, which should be a bokeh model. If not model is supplied cb_obj is assumed to be the same as the model.
-
set_customjs_callback(js_callback, handle)¶ Generates a CustomJS callback by generating the required JS code and gathering all plotting handles and installs it on the requested callback handle.
-
set_server_callback(handle)¶ Set up on_change events for bokeh server interactions.
-
classmethod
-
class
holoviews.plotting.bokeh.callbacks.MouseLeaveCallback(plot, streams, source, **params)[source]¶ Bases:
holoviews.plotting.bokeh.callbacks.PointerXYCallbackReturns the mouse x/y-position on mouseleave event, i.e. when mouse leaves the plot canvas.
-
classmethod
attributes_js(attributes)¶ Generates JS code to look up attributes on JS objects from an attributes specification dictionary. If the specification references a plotting particular plotting handle it will also generate JS code to get the ID of the object.
Simple example (when referencing cb_data or cb_obj):
Input : {‘x’: ‘cb_data.geometry.x’}
Output : data[‘x’] = cb_data[‘geometry’][‘x’]
Example referencing plot handle:
Input : {‘x0’: ‘x_range.attributes.start’}
- Outputif ((x_range !== undefined)) {
data[‘x0’] = {id: x_range[‘id’], value: x_range[‘attributes’][‘start’]}
}
-
get_customjs(references, plot_id=None)¶ Creates a CustomJS callback that will send the requested attributes back to python.
-
on_change(attr, old, new)¶ Process change events adding timeout to process multiple concerted value change at once rather than firing off multiple plot updates.
-
on_event(event)¶ Process bokeh UIEvents adding timeout to process multiple concerted value change at once rather than firing off multiple plot updates.
-
process_on_event()¶ Trigger callback change event and triggering corresponding streams.
-
classmethod
resolve_attr_spec(spec, cb_obj, model=None)¶ Resolves a Callback attribute specification looking the corresponding attribute up on the cb_obj, which should be a bokeh model. If not model is supplied cb_obj is assumed to be the same as the model.
-
set_customjs_callback(js_callback, handle)¶ Generates a CustomJS callback by generating the required JS code and gathering all plotting handles and installs it on the requested callback handle.
-
set_server_callback(handle)¶ Set up on_change events for bokeh server interactions.
-
classmethod
-
class
holoviews.plotting.bokeh.callbacks.PanEndCallback(plot, streams, source, **params)[source]¶ Bases:
holoviews.plotting.bokeh.callbacks.TapCallbackReturns the mouse x/y-position of a pan end event.
-
classmethod
attributes_js(attributes)¶ Generates JS code to look up attributes on JS objects from an attributes specification dictionary. If the specification references a plotting particular plotting handle it will also generate JS code to get the ID of the object.
Simple example (when referencing cb_data or cb_obj):
Input : {‘x’: ‘cb_data.geometry.x’}
Output : data[‘x’] = cb_data[‘geometry’][‘x’]
Example referencing plot handle:
Input : {‘x0’: ‘x_range.attributes.start’}
- Outputif ((x_range !== undefined)) {
data[‘x0’] = {id: x_range[‘id’], value: x_range[‘attributes’][‘start’]}
}
-
get_customjs(references, plot_id=None)¶ Creates a CustomJS callback that will send the requested attributes back to python.
-
on_change(attr, old, new)¶ Process change events adding timeout to process multiple concerted value change at once rather than firing off multiple plot updates.
-
on_event(event)¶ Process bokeh UIEvents adding timeout to process multiple concerted value change at once rather than firing off multiple plot updates.
-
process_on_event()¶ Trigger callback change event and triggering corresponding streams.
-
classmethod
resolve_attr_spec(spec, cb_obj, model=None)¶ Resolves a Callback attribute specification looking the corresponding attribute up on the cb_obj, which should be a bokeh model. If not model is supplied cb_obj is assumed to be the same as the model.
-
set_customjs_callback(js_callback, handle)¶ Generates a CustomJS callback by generating the required JS code and gathering all plotting handles and installs it on the requested callback handle.
-
set_server_callback(handle)¶ Set up on_change events for bokeh server interactions.
-
classmethod
-
class
holoviews.plotting.bokeh.callbacks.PlotSizeCallback(plot, streams, source, **params)[source]¶ Bases:
holoviews.plotting.bokeh.callbacks.CallbackReturns the actual width and height of a plot once the layout solver has executed.
-
classmethod
attributes_js(attributes)¶ Generates JS code to look up attributes on JS objects from an attributes specification dictionary. If the specification references a plotting particular plotting handle it will also generate JS code to get the ID of the object.
Simple example (when referencing cb_data or cb_obj):
Input : {‘x’: ‘cb_data.geometry.x’}
Output : data[‘x’] = cb_data[‘geometry’][‘x’]
Example referencing plot handle:
Input : {‘x0’: ‘x_range.attributes.start’}
- Outputif ((x_range !== undefined)) {
data[‘x0’] = {id: x_range[‘id’], value: x_range[‘attributes’][‘start’]}
}
-
get_customjs(references, plot_id=None)¶ Creates a CustomJS callback that will send the requested attributes back to python.
-
on_change(attr, old, new)¶ Process change events adding timeout to process multiple concerted value change at once rather than firing off multiple plot updates.
-
on_event(event)¶ Process bokeh UIEvents adding timeout to process multiple concerted value change at once rather than firing off multiple plot updates.
-
process_on_event()¶ Trigger callback change event and triggering corresponding streams.
-
classmethod
resolve_attr_spec(spec, cb_obj, model=None)¶ Resolves a Callback attribute specification looking the corresponding attribute up on the cb_obj, which should be a bokeh model. If not model is supplied cb_obj is assumed to be the same as the model.
-
set_customjs_callback(js_callback, handle)¶ Generates a CustomJS callback by generating the required JS code and gathering all plotting handles and installs it on the requested callback handle.
-
set_server_callback(handle)¶ Set up on_change events for bokeh server interactions.
-
classmethod
-
class
holoviews.plotting.bokeh.callbacks.PointDrawCallback(plot, streams, source, **params)[source]¶ Bases:
holoviews.plotting.bokeh.callbacks.GlyphDrawCallback-
classmethod
attributes_js(attributes)¶ Generates JS code to look up attributes on JS objects from an attributes specification dictionary. If the specification references a plotting particular plotting handle it will also generate JS code to get the ID of the object.
Simple example (when referencing cb_data or cb_obj):
Input : {‘x’: ‘cb_data.geometry.x’}
Output : data[‘x’] = cb_data[‘geometry’][‘x’]
Example referencing plot handle:
Input : {‘x0’: ‘x_range.attributes.start’}
- Outputif ((x_range !== undefined)) {
data[‘x0’] = {id: x_range[‘id’], value: x_range[‘attributes’][‘start’]}
}
-
get_customjs(references, plot_id=None)¶ Creates a CustomJS callback that will send the requested attributes back to python.
-
on_change(attr, old, new)¶ Process change events adding timeout to process multiple concerted value change at once rather than firing off multiple plot updates.
-
on_event(event)¶ Process bokeh UIEvents adding timeout to process multiple concerted value change at once rather than firing off multiple plot updates.
-
process_on_event()¶ Trigger callback change event and triggering corresponding streams.
-
classmethod
resolve_attr_spec(spec, cb_obj, model=None)¶ Resolves a Callback attribute specification looking the corresponding attribute up on the cb_obj, which should be a bokeh model. If not model is supplied cb_obj is assumed to be the same as the model.
-
set_customjs_callback(js_callback, handle)¶ Generates a CustomJS callback by generating the required JS code and gathering all plotting handles and installs it on the requested callback handle.
-
set_server_callback(handle)¶ Set up on_change events for bokeh server interactions.
-
classmethod
-
class
holoviews.plotting.bokeh.callbacks.PointerXCallback(plot, streams, source, **params)[source]¶ Bases:
holoviews.plotting.bokeh.callbacks.PointerXYCallbackReturns the mouse x-position on mousemove event.
-
classmethod
attributes_js(attributes)¶ Generates JS code to look up attributes on JS objects from an attributes specification dictionary. If the specification references a plotting particular plotting handle it will also generate JS code to get the ID of the object.
Simple example (when referencing cb_data or cb_obj):
Input : {‘x’: ‘cb_data.geometry.x’}
Output : data[‘x’] = cb_data[‘geometry’][‘x’]
Example referencing plot handle:
Input : {‘x0’: ‘x_range.attributes.start’}
- Outputif ((x_range !== undefined)) {
data[‘x0’] = {id: x_range[‘id’], value: x_range[‘attributes’][‘start’]}
}
-
get_customjs(references, plot_id=None)¶ Creates a CustomJS callback that will send the requested attributes back to python.
-
on_change(attr, old, new)¶ Process change events adding timeout to process multiple concerted value change at once rather than firing off multiple plot updates.
-
on_event(event)¶ Process bokeh UIEvents adding timeout to process multiple concerted value change at once rather than firing off multiple plot updates.
-
process_on_event()¶ Trigger callback change event and triggering corresponding streams.
-
classmethod
resolve_attr_spec(spec, cb_obj, model=None)¶ Resolves a Callback attribute specification looking the corresponding attribute up on the cb_obj, which should be a bokeh model. If not model is supplied cb_obj is assumed to be the same as the model.
-
set_customjs_callback(js_callback, handle)¶ Generates a CustomJS callback by generating the required JS code and gathering all plotting handles and installs it on the requested callback handle.
-
set_server_callback(handle)¶ Set up on_change events for bokeh server interactions.
-
classmethod
-
class
holoviews.plotting.bokeh.callbacks.PointerXYCallback(plot, streams, source, **params)[source]¶ Bases:
holoviews.plotting.bokeh.callbacks.CallbackReturns the mouse x/y-position on mousemove event.
-
classmethod
attributes_js(attributes)¶ Generates JS code to look up attributes on JS objects from an attributes specification dictionary. If the specification references a plotting particular plotting handle it will also generate JS code to get the ID of the object.
Simple example (when referencing cb_data or cb_obj):
Input : {‘x’: ‘cb_data.geometry.x’}
Output : data[‘x’] = cb_data[‘geometry’][‘x’]
Example referencing plot handle:
Input : {‘x0’: ‘x_range.attributes.start’}
- Outputif ((x_range !== undefined)) {
data[‘x0’] = {id: x_range[‘id’], value: x_range[‘attributes’][‘start’]}
}
-
get_customjs(references, plot_id=None)¶ Creates a CustomJS callback that will send the requested attributes back to python.
-
on_change(attr, old, new)¶ Process change events adding timeout to process multiple concerted value change at once rather than firing off multiple plot updates.
-
on_event(event)¶ Process bokeh UIEvents adding timeout to process multiple concerted value change at once rather than firing off multiple plot updates.
-
process_on_event()¶ Trigger callback change event and triggering corresponding streams.
-
classmethod
resolve_attr_spec(spec, cb_obj, model=None)¶ Resolves a Callback attribute specification looking the corresponding attribute up on the cb_obj, which should be a bokeh model. If not model is supplied cb_obj is assumed to be the same as the model.
-
set_customjs_callback(js_callback, handle)¶ Generates a CustomJS callback by generating the required JS code and gathering all plotting handles and installs it on the requested callback handle.
-
set_server_callback(handle)¶ Set up on_change events for bokeh server interactions.
-
classmethod
-
class
holoviews.plotting.bokeh.callbacks.PointerYCallback(plot, streams, source, **params)[source]¶ Bases:
holoviews.plotting.bokeh.callbacks.PointerXYCallbackReturns the mouse x/y-position on mousemove event.
-
classmethod
attributes_js(attributes)¶ Generates JS code to look up attributes on JS objects from an attributes specification dictionary. If the specification references a plotting particular plotting handle it will also generate JS code to get the ID of the object.
Simple example (when referencing cb_data or cb_obj):
Input : {‘x’: ‘cb_data.geometry.x’}
Output : data[‘x’] = cb_data[‘geometry’][‘x’]
Example referencing plot handle:
Input : {‘x0’: ‘x_range.attributes.start’}
- Outputif ((x_range !== undefined)) {
data[‘x0’] = {id: x_range[‘id’], value: x_range[‘attributes’][‘start’]}
}
-
get_customjs(references, plot_id=None)¶ Creates a CustomJS callback that will send the requested attributes back to python.
-
on_change(attr, old, new)¶ Process change events adding timeout to process multiple concerted value change at once rather than firing off multiple plot updates.
-
on_event(event)¶ Process bokeh UIEvents adding timeout to process multiple concerted value change at once rather than firing off multiple plot updates.
-
process_on_event()¶ Trigger callback change event and triggering corresponding streams.
-
classmethod
resolve_attr_spec(spec, cb_obj, model=None)¶ Resolves a Callback attribute specification looking the corresponding attribute up on the cb_obj, which should be a bokeh model. If not model is supplied cb_obj is assumed to be the same as the model.
-
set_customjs_callback(js_callback, handle)¶ Generates a CustomJS callback by generating the required JS code and gathering all plotting handles and installs it on the requested callback handle.
-
set_server_callback(handle)¶ Set up on_change events for bokeh server interactions.
-
classmethod
-
class
holoviews.plotting.bokeh.callbacks.PolyDrawCallback(plot, streams, source, **params)[source]¶ Bases:
holoviews.plotting.bokeh.callbacks.GlyphDrawCallback-
classmethod
attributes_js(attributes)¶ Generates JS code to look up attributes on JS objects from an attributes specification dictionary. If the specification references a plotting particular plotting handle it will also generate JS code to get the ID of the object.
Simple example (when referencing cb_data or cb_obj):
Input : {‘x’: ‘cb_data.geometry.x’}
Output : data[‘x’] = cb_data[‘geometry’][‘x’]
Example referencing plot handle:
Input : {‘x0’: ‘x_range.attributes.start’}
- Outputif ((x_range !== undefined)) {
data[‘x0’] = {id: x_range[‘id’], value: x_range[‘attributes’][‘start’]}
}
-
get_customjs(references, plot_id=None)¶ Creates a CustomJS callback that will send the requested attributes back to python.
-
on_change(attr, old, new)¶ Process change events adding timeout to process multiple concerted value change at once rather than firing off multiple plot updates.
-
on_event(event)¶ Process bokeh UIEvents adding timeout to process multiple concerted value change at once rather than firing off multiple plot updates.
-
process_on_event()¶ Trigger callback change event and triggering corresponding streams.
-
classmethod
resolve_attr_spec(spec, cb_obj, model=None)¶ Resolves a Callback attribute specification looking the corresponding attribute up on the cb_obj, which should be a bokeh model. If not model is supplied cb_obj is assumed to be the same as the model.
-
set_customjs_callback(js_callback, handle)¶ Generates a CustomJS callback by generating the required JS code and gathering all plotting handles and installs it on the requested callback handle.
-
set_server_callback(handle)¶ Set up on_change events for bokeh server interactions.
-
classmethod
-
class
holoviews.plotting.bokeh.callbacks.PolyEditCallback(plot, streams, source, **params)[source]¶ Bases:
holoviews.plotting.bokeh.callbacks.PolyDrawCallback-
classmethod
attributes_js(attributes)¶ Generates JS code to look up attributes on JS objects from an attributes specification dictionary. If the specification references a plotting particular plotting handle it will also generate JS code to get the ID of the object.
Simple example (when referencing cb_data or cb_obj):
Input : {‘x’: ‘cb_data.geometry.x’}
Output : data[‘x’] = cb_data[‘geometry’][‘x’]
Example referencing plot handle:
Input : {‘x0’: ‘x_range.attributes.start’}
- Outputif ((x_range !== undefined)) {
data[‘x0’] = {id: x_range[‘id’], value: x_range[‘attributes’][‘start’]}
}
-
get_customjs(references, plot_id=None)¶ Creates a CustomJS callback that will send the requested attributes back to python.
-
on_change(attr, old, new)¶ Process change events adding timeout to process multiple concerted value change at once rather than firing off multiple plot updates.
-
on_event(event)¶ Process bokeh UIEvents adding timeout to process multiple concerted value change at once rather than firing off multiple plot updates.
-
process_on_event()¶ Trigger callback change event and triggering corresponding streams.
-
classmethod
resolve_attr_spec(spec, cb_obj, model=None)¶ Resolves a Callback attribute specification looking the corresponding attribute up on the cb_obj, which should be a bokeh model. If not model is supplied cb_obj is assumed to be the same as the model.
-
set_customjs_callback(js_callback, handle)¶ Generates a CustomJS callback by generating the required JS code and gathering all plotting handles and installs it on the requested callback handle.
-
set_server_callback(handle)¶ Set up on_change events for bokeh server interactions.
-
classmethod
-
class
holoviews.plotting.bokeh.callbacks.PressUpCallback(plot, streams, source, **params)[source]¶ Bases:
holoviews.plotting.bokeh.callbacks.TapCallbackReturns the mouse x/y-position of a pressup mouse event.
-
classmethod
attributes_js(attributes)¶ Generates JS code to look up attributes on JS objects from an attributes specification dictionary. If the specification references a plotting particular plotting handle it will also generate JS code to get the ID of the object.
Simple example (when referencing cb_data or cb_obj):
Input : {‘x’: ‘cb_data.geometry.x’}
Output : data[‘x’] = cb_data[‘geometry’][‘x’]
Example referencing plot handle:
Input : {‘x0’: ‘x_range.attributes.start’}
- Outputif ((x_range !== undefined)) {
data[‘x0’] = {id: x_range[‘id’], value: x_range[‘attributes’][‘start’]}
}
-
get_customjs(references, plot_id=None)¶ Creates a CustomJS callback that will send the requested attributes back to python.
-
on_change(attr, old, new)¶ Process change events adding timeout to process multiple concerted value change at once rather than firing off multiple plot updates.
-
on_event(event)¶ Process bokeh UIEvents adding timeout to process multiple concerted value change at once rather than firing off multiple plot updates.
-
process_on_event()¶ Trigger callback change event and triggering corresponding streams.
-
classmethod
resolve_attr_spec(spec, cb_obj, model=None)¶ Resolves a Callback attribute specification looking the corresponding attribute up on the cb_obj, which should be a bokeh model. If not model is supplied cb_obj is assumed to be the same as the model.
-
set_customjs_callback(js_callback, handle)¶ Generates a CustomJS callback by generating the required JS code and gathering all plotting handles and installs it on the requested callback handle.
-
set_server_callback(handle)¶ Set up on_change events for bokeh server interactions.
-
classmethod
-
class
holoviews.plotting.bokeh.callbacks.RangeToolLinkCallback(root_model, link, source_plot, target_plot)[source]¶ Bases:
holoviews.plotting.bokeh.callbacks.LinkCallbackAttaches a RangeTool to the source plot and links it to the specified axes on the target plot
-
classmethod
find_link(plot, link=None)¶ Searches a GenericElementPlot for a Link.
-
classmethod
find_links(root_plot)¶ Traverses the supplied plot and searches for any Links on the plotted objects.
-
validate()¶ Should be subclassed to check if the source and target plots are compatible to perform the linking.
-
classmethod
-
class
holoviews.plotting.bokeh.callbacks.RangeXCallback(plot, streams, source, **params)[source]¶ Bases:
holoviews.plotting.bokeh.callbacks.RangeXYCallbackReturns the x-axis range of a plot.
-
classmethod
attributes_js(attributes)¶ Generates JS code to look up attributes on JS objects from an attributes specification dictionary. If the specification references a plotting particular plotting handle it will also generate JS code to get the ID of the object.
Simple example (when referencing cb_data or cb_obj):
Input : {‘x’: ‘cb_data.geometry.x’}
Output : data[‘x’] = cb_data[‘geometry’][‘x’]
Example referencing plot handle:
Input : {‘x0’: ‘x_range.attributes.start’}
- Outputif ((x_range !== undefined)) {
data[‘x0’] = {id: x_range[‘id’], value: x_range[‘attributes’][‘start’]}
}
-
get_customjs(references, plot_id=None)¶ Creates a CustomJS callback that will send the requested attributes back to python.
-
on_change(attr, old, new)¶ Process change events adding timeout to process multiple concerted value change at once rather than firing off multiple plot updates.
-
on_event(event)¶ Process bokeh UIEvents adding timeout to process multiple concerted value change at once rather than firing off multiple plot updates.
-
process_on_event()¶ Trigger callback change event and triggering corresponding streams.
-
classmethod
resolve_attr_spec(spec, cb_obj, model=None)¶ Resolves a Callback attribute specification looking the corresponding attribute up on the cb_obj, which should be a bokeh model. If not model is supplied cb_obj is assumed to be the same as the model.
-
set_customjs_callback(js_callback, handle)¶ Generates a CustomJS callback by generating the required JS code and gathering all plotting handles and installs it on the requested callback handle.
-
set_server_callback(handle)¶ Set up on_change events for bokeh server interactions.
-
classmethod
-
class
holoviews.plotting.bokeh.callbacks.RangeXYCallback(plot, streams, source, **params)[source]¶ Bases:
holoviews.plotting.bokeh.callbacks.CallbackReturns the x/y-axis ranges of a plot.
-
classmethod
attributes_js(attributes)¶ Generates JS code to look up attributes on JS objects from an attributes specification dictionary. If the specification references a plotting particular plotting handle it will also generate JS code to get the ID of the object.
Simple example (when referencing cb_data or cb_obj):
Input : {‘x’: ‘cb_data.geometry.x’}
Output : data[‘x’] = cb_data[‘geometry’][‘x’]
Example referencing plot handle:
Input : {‘x0’: ‘x_range.attributes.start’}
- Outputif ((x_range !== undefined)) {
data[‘x0’] = {id: x_range[‘id’], value: x_range[‘attributes’][‘start’]}
}
-
get_customjs(references, plot_id=None)¶ Creates a CustomJS callback that will send the requested attributes back to python.
-
on_change(attr, old, new)¶ Process change events adding timeout to process multiple concerted value change at once rather than firing off multiple plot updates.
-
on_event(event)¶ Process bokeh UIEvents adding timeout to process multiple concerted value change at once rather than firing off multiple plot updates.
-
process_on_event()¶ Trigger callback change event and triggering corresponding streams.
-
classmethod
resolve_attr_spec(spec, cb_obj, model=None)¶ Resolves a Callback attribute specification looking the corresponding attribute up on the cb_obj, which should be a bokeh model. If not model is supplied cb_obj is assumed to be the same as the model.
-
set_customjs_callback(js_callback, handle)¶ Generates a CustomJS callback by generating the required JS code and gathering all plotting handles and installs it on the requested callback handle.
-
set_server_callback(handle)¶ Set up on_change events for bokeh server interactions.
-
classmethod
-
class
holoviews.plotting.bokeh.callbacks.RangeYCallback(plot, streams, source, **params)[source]¶ Bases:
holoviews.plotting.bokeh.callbacks.RangeXYCallbackReturns the y-axis range of a plot.
-
classmethod
attributes_js(attributes)¶ Generates JS code to look up attributes on JS objects from an attributes specification dictionary. If the specification references a plotting particular plotting handle it will also generate JS code to get the ID of the object.
Simple example (when referencing cb_data or cb_obj):
Input : {‘x’: ‘cb_data.geometry.x’}
Output : data[‘x’] = cb_data[‘geometry’][‘x’]
Example referencing plot handle:
Input : {‘x0’: ‘x_range.attributes.start’}
- Outputif ((x_range !== undefined)) {
data[‘x0’] = {id: x_range[‘id’], value: x_range[‘attributes’][‘start’]}
}
-
get_customjs(references, plot_id=None)¶ Creates a CustomJS callback that will send the requested attributes back to python.
-
on_change(attr, old, new)¶ Process change events adding timeout to process multiple concerted value change at once rather than firing off multiple plot updates.
-
on_event(event)¶ Process bokeh UIEvents adding timeout to process multiple concerted value change at once rather than firing off multiple plot updates.
-
process_on_event()¶ Trigger callback change event and triggering corresponding streams.
-
classmethod
resolve_attr_spec(spec, cb_obj, model=None)¶ Resolves a Callback attribute specification looking the corresponding attribute up on the cb_obj, which should be a bokeh model. If not model is supplied cb_obj is assumed to be the same as the model.
-
set_customjs_callback(js_callback, handle)¶ Generates a CustomJS callback by generating the required JS code and gathering all plotting handles and installs it on the requested callback handle.
-
set_server_callback(handle)¶ Set up on_change events for bokeh server interactions.
-
classmethod
-
class
holoviews.plotting.bokeh.callbacks.RectanglesTableLinkCallback(root_model, link, source_plot, target_plot=None)[source]¶ Bases:
holoviews.plotting.bokeh.callbacks.DataLinkCallback-
classmethod
find_link(plot, link=None)¶ Searches a GenericElementPlot for a Link.
-
classmethod
find_links(root_plot)¶ Traverses the supplied plot and searches for any Links on the plotted objects.
-
validate()¶ Should be subclassed to check if the source and target plots are compatible to perform the linking.
-
classmethod
-
class
holoviews.plotting.bokeh.callbacks.ResetCallback(plot, streams, source, **params)[source]¶ Bases:
holoviews.plotting.bokeh.callbacks.CallbackSignals the Reset stream if an event has been triggered.
-
classmethod
attributes_js(attributes)¶ Generates JS code to look up attributes on JS objects from an attributes specification dictionary. If the specification references a plotting particular plotting handle it will also generate JS code to get the ID of the object.
Simple example (when referencing cb_data or cb_obj):
Input : {‘x’: ‘cb_data.geometry.x’}
Output : data[‘x’] = cb_data[‘geometry’][‘x’]
Example referencing plot handle:
Input : {‘x0’: ‘x_range.attributes.start’}
- Outputif ((x_range !== undefined)) {
data[‘x0’] = {id: x_range[‘id’], value: x_range[‘attributes’][‘start’]}
}
-
get_customjs(references, plot_id=None)¶ Creates a CustomJS callback that will send the requested attributes back to python.
-
on_change(attr, old, new)¶ Process change events adding timeout to process multiple concerted value change at once rather than firing off multiple plot updates.
-
on_event(event)¶ Process bokeh UIEvents adding timeout to process multiple concerted value change at once rather than firing off multiple plot updates.
-
process_on_event()¶ Trigger callback change event and triggering corresponding streams.
-
classmethod
resolve_attr_spec(spec, cb_obj, model=None)¶ Resolves a Callback attribute specification looking the corresponding attribute up on the cb_obj, which should be a bokeh model. If not model is supplied cb_obj is assumed to be the same as the model.
-
set_customjs_callback(js_callback, handle)¶ Generates a CustomJS callback by generating the required JS code and gathering all plotting handles and installs it on the requested callback handle.
-
set_server_callback(handle)¶ Set up on_change events for bokeh server interactions.
-
classmethod
-
class
holoviews.plotting.bokeh.callbacks.SelectModeCallback(plot, streams, source, **params)[source]¶ Bases:
holoviews.plotting.bokeh.callbacks.Callback-
classmethod
attributes_js(attributes)¶ Generates JS code to look up attributes on JS objects from an attributes specification dictionary. If the specification references a plotting particular plotting handle it will also generate JS code to get the ID of the object.
Simple example (when referencing cb_data or cb_obj):
Input : {‘x’: ‘cb_data.geometry.x’}
Output : data[‘x’] = cb_data[‘geometry’][‘x’]
Example referencing plot handle:
Input : {‘x0’: ‘x_range.attributes.start’}
- Outputif ((x_range !== undefined)) {
data[‘x0’] = {id: x_range[‘id’], value: x_range[‘attributes’][‘start’]}
}
-
get_customjs(references, plot_id=None)¶ Creates a CustomJS callback that will send the requested attributes back to python.
-
on_change(attr, old, new)¶ Process change events adding timeout to process multiple concerted value change at once rather than firing off multiple plot updates.
-
on_event(event)¶ Process bokeh UIEvents adding timeout to process multiple concerted value change at once rather than firing off multiple plot updates.
-
process_on_event()¶ Trigger callback change event and triggering corresponding streams.
-
classmethod
resolve_attr_spec(spec, cb_obj, model=None)¶ Resolves a Callback attribute specification looking the corresponding attribute up on the cb_obj, which should be a bokeh model. If not model is supplied cb_obj is assumed to be the same as the model.
-
set_customjs_callback(js_callback, handle)¶ Generates a CustomJS callback by generating the required JS code and gathering all plotting handles and installs it on the requested callback handle.
-
set_server_callback(handle)¶ Set up on_change events for bokeh server interactions.
-
classmethod
-
class
holoviews.plotting.bokeh.callbacks.Selection1DCallback(plot, streams, source, **params)[source]¶ Bases:
holoviews.plotting.bokeh.callbacks.CallbackReturns the current selection on a ColumnDataSource.
-
classmethod
attributes_js(attributes)¶ Generates JS code to look up attributes on JS objects from an attributes specification dictionary. If the specification references a plotting particular plotting handle it will also generate JS code to get the ID of the object.
Simple example (when referencing cb_data or cb_obj):
Input : {‘x’: ‘cb_data.geometry.x’}
Output : data[‘x’] = cb_data[‘geometry’][‘x’]
Example referencing plot handle:
Input : {‘x0’: ‘x_range.attributes.start’}
- Outputif ((x_range !== undefined)) {
data[‘x0’] = {id: x_range[‘id’], value: x_range[‘attributes’][‘start’]}
}
-
get_customjs(references, plot_id=None)¶ Creates a CustomJS callback that will send the requested attributes back to python.
-
on_change(attr, old, new)¶ Process change events adding timeout to process multiple concerted value change at once rather than firing off multiple plot updates.
-
on_event(event)¶ Process bokeh UIEvents adding timeout to process multiple concerted value change at once rather than firing off multiple plot updates.
-
process_on_event()¶ Trigger callback change event and triggering corresponding streams.
-
classmethod
resolve_attr_spec(spec, cb_obj, model=None)¶ Resolves a Callback attribute specification looking the corresponding attribute up on the cb_obj, which should be a bokeh model. If not model is supplied cb_obj is assumed to be the same as the model.
-
set_customjs_callback(js_callback, handle)¶ Generates a CustomJS callback by generating the required JS code and gathering all plotting handles and installs it on the requested callback handle.
-
set_server_callback(handle)¶ Set up on_change events for bokeh server interactions.
-
classmethod
-
class
holoviews.plotting.bokeh.callbacks.SelectionLinkCallback(root_model, link, source_plot, target_plot=None)[source]¶ Bases:
holoviews.plotting.bokeh.callbacks.LinkCallback-
classmethod
find_link(plot, link=None)¶ Searches a GenericElementPlot for a Link.
-
classmethod
find_links(root_plot)¶ Traverses the supplied plot and searches for any Links on the plotted objects.
-
validate()¶ Should be subclassed to check if the source and target plots are compatible to perform the linking.
-
classmethod
-
class
holoviews.plotting.bokeh.callbacks.SelectionXYCallback(plot, streams, source, **params)[source]¶ Bases:
holoviews.plotting.bokeh.callbacks.BoundsCallbackConverts a bounds selection to numeric or categorical x-range and y-range selections.
-
classmethod
attributes_js(attributes)¶ Generates JS code to look up attributes on JS objects from an attributes specification dictionary. If the specification references a plotting particular plotting handle it will also generate JS code to get the ID of the object.
Simple example (when referencing cb_data or cb_obj):
Input : {‘x’: ‘cb_data.geometry.x’}
Output : data[‘x’] = cb_data[‘geometry’][‘x’]
Example referencing plot handle:
Input : {‘x0’: ‘x_range.attributes.start’}
- Outputif ((x_range !== undefined)) {
data[‘x0’] = {id: x_range[‘id’], value: x_range[‘attributes’][‘start’]}
}
-
get_customjs(references, plot_id=None)¶ Creates a CustomJS callback that will send the requested attributes back to python.
-
on_change(attr, old, new)¶ Process change events adding timeout to process multiple concerted value change at once rather than firing off multiple plot updates.
-
on_event(event)¶ Process bokeh UIEvents adding timeout to process multiple concerted value change at once rather than firing off multiple plot updates.
-
process_on_event()¶ Trigger callback change event and triggering corresponding streams.
-
classmethod
resolve_attr_spec(spec, cb_obj, model=None)¶ Resolves a Callback attribute specification looking the corresponding attribute up on the cb_obj, which should be a bokeh model. If not model is supplied cb_obj is assumed to be the same as the model.
-
set_customjs_callback(js_callback, handle)¶ Generates a CustomJS callback by generating the required JS code and gathering all plotting handles and installs it on the requested callback handle.
-
set_server_callback(handle)¶ Set up on_change events for bokeh server interactions.
-
classmethod
-
class
holoviews.plotting.bokeh.callbacks.ServerCallback(plot, streams, source, **params)[source]¶ Bases:
holoviews.plotting.bokeh.callbacks.MessageCallbackImplements methods to set up bokeh server callbacks. A ServerCallback resolves the requested attributes on the Python end and then hands the msg off to the general on_msg handler, which will update the Stream(s) attached to the callback.
The ServerCallback supports three different throttling modes:
adaptive (default): The callback adapts the throttling timeout depending on the rolling mean of the time taken to process each message. The rolling window is controlled by the adaptive_window value.
throttle: Uses the fixed throttle_timeout as the minimum amount of time between events.
debounce: Processes the message only when no new event has been received within the throttle_timeout duration.
-
on_change(attr, old, new)[source]¶ Process change events adding timeout to process multiple concerted value change at once rather than firing off multiple plot updates.
-
on_event(event)[source]¶ Process bokeh UIEvents adding timeout to process multiple concerted value change at once rather than firing off multiple plot updates.
-
class
holoviews.plotting.bokeh.callbacks.SingleTapCallback(plot, streams, source, **params)[source]¶ Bases:
holoviews.plotting.bokeh.callbacks.TapCallbackReturns the mouse x/y-position on tap event.
-
classmethod
attributes_js(attributes)¶ Generates JS code to look up attributes on JS objects from an attributes specification dictionary. If the specification references a plotting particular plotting handle it will also generate JS code to get the ID of the object.
Simple example (when referencing cb_data or cb_obj):
Input : {‘x’: ‘cb_data.geometry.x’}
Output : data[‘x’] = cb_data[‘geometry’][‘x’]
Example referencing plot handle:
Input : {‘x0’: ‘x_range.attributes.start’}
- Outputif ((x_range !== undefined)) {
data[‘x0’] = {id: x_range[‘id’], value: x_range[‘attributes’][‘start’]}
}
-
get_customjs(references, plot_id=None)¶ Creates a CustomJS callback that will send the requested attributes back to python.
-
on_change(attr, old, new)¶ Process change events adding timeout to process multiple concerted value change at once rather than firing off multiple plot updates.
-
on_event(event)¶ Process bokeh UIEvents adding timeout to process multiple concerted value change at once rather than firing off multiple plot updates.
-
process_on_event()¶ Trigger callback change event and triggering corresponding streams.
-
classmethod
resolve_attr_spec(spec, cb_obj, model=None)¶ Resolves a Callback attribute specification looking the corresponding attribute up on the cb_obj, which should be a bokeh model. If not model is supplied cb_obj is assumed to be the same as the model.
-
set_customjs_callback(js_callback, handle)¶ Generates a CustomJS callback by generating the required JS code and gathering all plotting handles and installs it on the requested callback handle.
-
set_server_callback(handle)¶ Set up on_change events for bokeh server interactions.
-
classmethod
-
class
holoviews.plotting.bokeh.callbacks.TapCallback(plot, streams, source, **params)[source]¶ Bases:
holoviews.plotting.bokeh.callbacks.PointerXYCallbackReturns the mouse x/y-position on tap event.
Note: As of bokeh 0.12.5, there is no way to distinguish the individual tap events within a doubletap event.
-
classmethod
attributes_js(attributes)¶ Generates JS code to look up attributes on JS objects from an attributes specification dictionary. If the specification references a plotting particular plotting handle it will also generate JS code to get the ID of the object.
Simple example (when referencing cb_data or cb_obj):
Input : {‘x’: ‘cb_data.geometry.x’}
Output : data[‘x’] = cb_data[‘geometry’][‘x’]
Example referencing plot handle:
Input : {‘x0’: ‘x_range.attributes.start’}
- Outputif ((x_range !== undefined)) {
data[‘x0’] = {id: x_range[‘id’], value: x_range[‘attributes’][‘start’]}
}
-
get_customjs(references, plot_id=None)¶ Creates a CustomJS callback that will send the requested attributes back to python.
-
on_change(attr, old, new)¶ Process change events adding timeout to process multiple concerted value change at once rather than firing off multiple plot updates.
-
on_event(event)¶ Process bokeh UIEvents adding timeout to process multiple concerted value change at once rather than firing off multiple plot updates.
-
process_on_event()¶ Trigger callback change event and triggering corresponding streams.
-
classmethod
resolve_attr_spec(spec, cb_obj, model=None)¶ Resolves a Callback attribute specification looking the corresponding attribute up on the cb_obj, which should be a bokeh model. If not model is supplied cb_obj is assumed to be the same as the model.
-
set_customjs_callback(js_callback, handle)¶ Generates a CustomJS callback by generating the required JS code and gathering all plotting handles and installs it on the requested callback handle.
-
set_server_callback(handle)¶ Set up on_change events for bokeh server interactions.
-
classmethod
-
class
holoviews.plotting.bokeh.callbacks.VertexTableLinkCallback(root_model, link, source_plot, target_plot=None)[source]¶ Bases:
holoviews.plotting.bokeh.callbacks.LinkCallback-
classmethod
find_link(plot, link=None)¶ Searches a GenericElementPlot for a Link.
-
classmethod
find_links(root_plot)¶ Traverses the supplied plot and searches for any Links on the plotted objects.
-
validate()¶ Should be subclassed to check if the source and target plots are compatible to perform the linking.
-
classmethod
chart Module
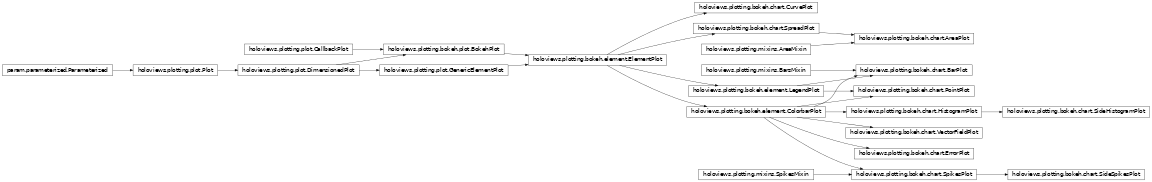
-
class
holoviews.plotting.bokeh.chart.AreaPlot(element, plot=None, **params)[source]¶ Bases:
holoviews.plotting.mixins.AreaMixin,holoviews.plotting.bokeh.chart.SpreadPlotParameters inherited from:
holoviews.plotting.plot.DimensionedPlot: fontscale, show_title, normalize, projectionholoviews.plotting.plot.GenericElementPlot: apply_ranges, apply_extents, bgcolor, default_span, hooks, invert_axes, invert_xaxis, invert_yaxis, finalize_hooks, logx, logy, show_legend, show_grid, xaxis, yaxis, xlabel, ylabel, xlim, ylim, zlim, xrotation, yrotation, xticks, yticksholoviews.plotting.bokeh.plot.BokehPlot: title, title_format, shared_datasourceholoviews.plotting.bokeh.element.ElementPlot: fontsize, toolbar, width, height, active_tools, align, border, aspect, data_aspect, frame_width, frame_height, min_width, min_height, max_width, max_height, margin, responsive, gridstyle, labelled, lod, show_frame, shared_axes, default_tools, tools, xformatter, yformatterpadding= param.ClassSelector(class_=(<class ‘int’>, <class ‘float’>, <class ‘tuple’>), default=(0, 0.1))Fraction by which to increase auto-ranged extents to make datapoints more visible around borders. To compute padding, the axis whose screen size is largest is chosen, and the range of that axis is increased by the specified fraction along each axis. Other axes are then padded ensuring that the amount of screen space devoted to padding is equal for all axes. If specified as a tuple, the int or float values in the tuple will be used for padding in each axis, in order (x,y or x,y,z). For example, for padding=0.2 on a 800x800-pixel plot, an x-axis with the range [0,10] will be padded by 20% to be [-1,11], while a y-axis with a range [0,1000] will be padded to be [-100,1100], which should make the padding be approximately the same number of pixels. But if the same plot is changed to have a height of only 200, the y-range will then be [-400,1400] so that the y-axis padding will still match that of the x-axis. It is also possible to declare non-equal padding value for the lower and upper bound of an axis by supplying nested tuples, e.g. padding=(0.1, (0, 0.1)) will pad the x-axis lower and upper bound as well as the y-axis upper bound by a fraction of 0.1 while the y-axis lower bound is not padded at all.
-
cleanup()¶ Cleans up references to the plot after the plot has been deleted. Traverses through all plots cleaning up Callbacks and Stream subscribers.
-
compute_ranges(obj, key, ranges)¶ Given an object, a specific key, and the normalization options, this method will find the specified normalization options on the appropriate OptionTree, group the elements according to the selected normalization option (i.e. either per frame or over the whole animation) and finally compute the dimension ranges in each group. The new set of ranges is returned.
-
property
current_handles¶ Should return a list of plot objects that have changed and should be updated.
-
property
framewise¶ Property to determine whether the current frame should have framewise normalization enabled. Required for bokeh plotting classes to determine whether to send updated ranges for each frame.
-
get_aspect(xspan, yspan)¶ Computes the aspect ratio of the plot
-
get_data(element, ranges, style)[source]¶ Returns the data from an element in the appropriate format for initializing or updating a ColumnDataSource and a dictionary which maps the expected keywords arguments of a glyph to the column in the datasource.
-
get_padding(obj, extents)¶ Computes padding along the axes taking into account the plot aspect.
-
get_zorder(overlay, key, el)¶ Computes the z-order of element in the NdOverlay taking into account possible batching of elements.
-
initialize_plot(ranges=None, plot=None, plots=None, source=None)¶ Initializes a new plot object with the last available frame.
-
property
link_sources¶ Returns potential Link or Stream sources.
-
matches(spec)¶ Matches a specification against the current Plot.
-
model_changed(model)¶ Determines if the bokeh model was just changed on the frontend. Useful to suppress boomeranging events, e.g. when the frontend just sent an update to the x_range this should not trigger an update on the backend.
-
push()¶ Pushes plot updates to the frontend.
-
refresh(**kwargs)¶ Refreshes the plot by rerendering it and then pushing the updated data if the plot has an associated Comm.
-
set_root(root)¶ Sets the root model on all subplots.
-
property
state¶ The plotting state that gets updated via the update method and used by the renderer to generate output.
-
sync_sources()¶ Syncs data sources between Elements, which draw data from the same object.
-
traverse(fn=None, specs=None, full_breadth=True)¶ Traverses any nested DimensionedPlot returning a list of all plots that match the specs. The specs should be supplied as a list of either Plot types or callables, which should return a boolean given the plot class.
-
update(key)¶ Update the internal state of the Plot to represent the given key tuple (where integers represent frames). Returns this state.
-
update_frame(key, ranges=None, plot=None, element=None)¶ Updates an existing plot with data corresponding to the key.
-
class
holoviews.plotting.bokeh.chart.BarPlot(element, plot=None, **params)[source]¶ Bases:
holoviews.plotting.mixins.BarsMixin,holoviews.plotting.bokeh.element.ColorbarPlot,holoviews.plotting.bokeh.element.LegendPlotBarPlot allows generating single- or multi-category bar Charts, by selecting which key dimensions are mapped onto separate groups, categories and stacks.
Parameters inherited from:
holoviews.plotting.plot.DimensionedPlot: fontscale, show_title, normalize, projectionholoviews.plotting.plot.GenericElementPlot: apply_ranges, apply_extents, bgcolor, default_span, hooks, invert_axes, invert_xaxis, invert_yaxis, finalize_hooks, logx, logy, padding, show_legend, show_grid, xaxis, yaxis, xlabel, ylabel, xlim, ylim, zlim, xrotation, yrotation, xticks, yticksholoviews.plotting.bokeh.plot.BokehPlot: title, title_format, shared_datasourceholoviews.plotting.bokeh.element.ElementPlot: fontsize, toolbar, width, height, active_tools, align, border, aspect, data_aspect, frame_width, frame_height, min_width, min_height, max_width, max_height, margin, responsive, gridstyle, labelled, lod, show_frame, shared_axes, default_tools, tools, xformatter, yformatterholoviews.plotting.bokeh.element.LegendPlot: legend_position, legend_muted, legend_offset, legend_cols, legend_optsholoviews.plotting.bokeh.element.ColorbarPlot: color_levels, clabel, clim, cformatter, colorbar, colorbar_position, colorbar_opts, clipping_colors, logz, symmetricmulti_level= param.Boolean(bounds=(0, 1), default=True)Whether the Bars should be grouped into a second categorical axis level.
stacked= param.Boolean(bounds=(0, 1), default=False)Whether the bars should be stacked or grouped.
color_index= param.ClassSelector(class_=(<class ‘str’>, <class ‘int’>))Deprecated in favor of color style mapping, e.g. color=dim(‘color’)
-
cleanup()¶ Cleans up references to the plot after the plot has been deleted. Traverses through all plots cleaning up Callbacks and Stream subscribers.
-
compute_ranges(obj, key, ranges)¶ Given an object, a specific key, and the normalization options, this method will find the specified normalization options on the appropriate OptionTree, group the elements according to the selected normalization option (i.e. either per frame or over the whole animation) and finally compute the dimension ranges in each group. The new set of ranges is returned.
-
property
current_handles¶ Should return a list of plot objects that have changed and should be updated.
-
property
framewise¶ Property to determine whether the current frame should have framewise normalization enabled. Required for bokeh plotting classes to determine whether to send updated ranges for each frame.
-
get_aspect(xspan, yspan)¶ Computes the aspect ratio of the plot
-
get_data(element, ranges, style)[source]¶ Returns the data from an element in the appropriate format for initializing or updating a ColumnDataSource and a dictionary which maps the expected keywords arguments of a glyph to the column in the datasource.
-
get_extents(element, ranges, range_type='combined')¶ Make adjustments to plot extents by computing stacked bar heights, adjusting the bar baseline and forcing the x-axis to be categorical.
-
get_padding(obj, extents)¶ Computes padding along the axes taking into account the plot aspect.
-
get_stack(xvals, yvals, baselines, sign='positive')[source]¶ Iterates over a x- and y-values in a stack layer and appropriately offsets the layer on top of the previous layer.
-
get_zorder(overlay, key, el)¶ Computes the z-order of element in the NdOverlay taking into account possible batching of elements.
-
initialize_plot(ranges=None, plot=None, plots=None, source=None)¶ Initializes a new plot object with the last available frame.
-
property
link_sources¶ Returns potential Link or Stream sources.
-
matches(spec)¶ Matches a specification against the current Plot.
-
model_changed(model)¶ Determines if the bokeh model was just changed on the frontend. Useful to suppress boomeranging events, e.g. when the frontend just sent an update to the x_range this should not trigger an update on the backend.
-
push()¶ Pushes plot updates to the frontend.
-
refresh(**kwargs)¶ Refreshes the plot by rerendering it and then pushing the updated data if the plot has an associated Comm.
-
set_root(root)¶ Sets the root model on all subplots.
-
property
state¶ The plotting state that gets updated via the update method and used by the renderer to generate output.
-
sync_sources()¶ Syncs data sources between Elements, which draw data from the same object.
-
traverse(fn=None, specs=None, full_breadth=True)¶ Traverses any nested DimensionedPlot returning a list of all plots that match the specs. The specs should be supplied as a list of either Plot types or callables, which should return a boolean given the plot class.
-
update(key)¶ Update the internal state of the Plot to represent the given key tuple (where integers represent frames). Returns this state.
-
update_frame(key, ranges=None, plot=None, element=None)¶ Updates an existing plot with data corresponding to the key.
-
class
holoviews.plotting.bokeh.chart.CurvePlot(element, plot=None, **params)[source]¶ Bases:
holoviews.plotting.bokeh.element.ElementPlotParameters inherited from:
holoviews.plotting.plot.DimensionedPlot: fontscale, show_title, normalize, projectionholoviews.plotting.plot.GenericElementPlot: apply_ranges, apply_extents, bgcolor, default_span, hooks, invert_axes, invert_xaxis, invert_yaxis, finalize_hooks, logx, logy, show_legend, show_grid, xaxis, yaxis, xlabel, ylabel, xlim, ylim, zlim, xrotation, yrotation, xticks, yticksholoviews.plotting.bokeh.plot.BokehPlot: title, title_format, shared_datasourceholoviews.plotting.bokeh.element.ElementPlot: fontsize, toolbar, width, height, active_tools, align, border, aspect, data_aspect, frame_width, frame_height, min_width, min_height, max_width, max_height, margin, responsive, gridstyle, labelled, lod, show_frame, shared_axes, default_tools, tools, xformatter, yformatterpadding= param.ClassSelector(class_=(<class ‘int’>, <class ‘float’>, <class ‘tuple’>), default=(0, 0.1))Fraction by which to increase auto-ranged extents to make datapoints more visible around borders. To compute padding, the axis whose screen size is largest is chosen, and the range of that axis is increased by the specified fraction along each axis. Other axes are then padded ensuring that the amount of screen space devoted to padding is equal for all axes. If specified as a tuple, the int or float values in the tuple will be used for padding in each axis, in order (x,y or x,y,z). For example, for padding=0.2 on a 800x800-pixel plot, an x-axis with the range [0,10] will be padded by 20% to be [-1,11], while a y-axis with a range [0,1000] will be padded to be [-100,1100], which should make the padding be approximately the same number of pixels. But if the same plot is changed to have a height of only 200, the y-range will then be [-400,1400] so that the y-axis padding will still match that of the x-axis. It is also possible to declare non-equal padding value for the lower and upper bound of an axis by supplying nested tuples, e.g. padding=(0.1, (0, 0.1)) will pad the x-axis lower and upper bound as well as the y-axis upper bound by a fraction of 0.1 while the y-axis lower bound is not padded at all.
interpolation= param.ObjectSelector(default=’linear’, objects=[‘linear’, ‘steps-mid’, ‘steps-pre’, ‘steps-post’])Defines how the samples of the Curve are interpolated, default is ‘linear’, other options include ‘steps-mid’, ‘steps-pre’ and ‘steps-post’.
-
cleanup()¶ Cleans up references to the plot after the plot has been deleted. Traverses through all plots cleaning up Callbacks and Stream subscribers.
-
compute_ranges(obj, key, ranges)¶ Given an object, a specific key, and the normalization options, this method will find the specified normalization options on the appropriate OptionTree, group the elements according to the selected normalization option (i.e. either per frame or over the whole animation) and finally compute the dimension ranges in each group. The new set of ranges is returned.
-
property
current_handles¶ Should return a list of plot objects that have changed and should be updated.
-
property
framewise¶ Property to determine whether the current frame should have framewise normalization enabled. Required for bokeh plotting classes to determine whether to send updated ranges for each frame.
-
get_aspect(xspan, yspan)¶ Computes the aspect ratio of the plot
-
get_data(element, ranges, style)[source]¶ Returns the data from an element in the appropriate format for initializing or updating a ColumnDataSource and a dictionary which maps the expected keywords arguments of a glyph to the column in the datasource.
-
get_extents(element, ranges, range_type='combined', xdim=None, ydim=None, zdim=None)¶ Gets the extents for the axes from the current Element. The globally computed ranges can optionally override the extents.
The extents are computed by combining the data ranges, extents and dimension ranges. Each of these can be obtained individually by setting the range_type to one of:
‘data’: Just the data ranges
‘extents’: Element.extents
‘soft’: Dimension.soft_range values
‘hard’: Dimension.range values
To obtain the combined range, which includes range padding the default may be used:
‘combined’: All the range types combined and padding applied
This allows Overlay plots to obtain each range and combine them appropriately for all the objects in the overlay.
-
get_padding(obj, extents)¶ Computes padding along the axes taking into account the plot aspect.
-
get_zorder(overlay, key, el)¶ Computes the z-order of element in the NdOverlay taking into account possible batching of elements.
-
initialize_plot(ranges=None, plot=None, plots=None, source=None)¶ Initializes a new plot object with the last available frame.
-
property
link_sources¶ Returns potential Link or Stream sources.
-
matches(spec)¶ Matches a specification against the current Plot.
-
model_changed(model)¶ Determines if the bokeh model was just changed on the frontend. Useful to suppress boomeranging events, e.g. when the frontend just sent an update to the x_range this should not trigger an update on the backend.
-
push()¶ Pushes plot updates to the frontend.
-
refresh(**kwargs)¶ Refreshes the plot by rerendering it and then pushing the updated data if the plot has an associated Comm.
-
set_root(root)¶ Sets the root model on all subplots.
-
property
state¶ The plotting state that gets updated via the update method and used by the renderer to generate output.
-
sync_sources()¶ Syncs data sources between Elements, which draw data from the same object.
-
traverse(fn=None, specs=None, full_breadth=True)¶ Traverses any nested DimensionedPlot returning a list of all plots that match the specs. The specs should be supplied as a list of either Plot types or callables, which should return a boolean given the plot class.
-
update(key)¶ Update the internal state of the Plot to represent the given key tuple (where integers represent frames). Returns this state.
-
update_frame(key, ranges=None, plot=None, element=None)¶ Updates an existing plot with data corresponding to the key.
-
class
holoviews.plotting.bokeh.chart.ErrorPlot(element, plot=None, **params)[source]¶ Bases:
holoviews.plotting.bokeh.element.ColorbarPlotParameters inherited from:
holoviews.plotting.plot.DimensionedPlot: fontscale, show_title, normalize, projectionholoviews.plotting.plot.GenericElementPlot: apply_ranges, apply_extents, bgcolor, default_span, hooks, invert_axes, invert_xaxis, invert_yaxis, finalize_hooks, logx, logy, padding, show_legend, show_grid, xaxis, yaxis, xlabel, ylabel, xlim, ylim, zlim, xrotation, yrotation, xticks, yticksholoviews.plotting.bokeh.plot.BokehPlot: title, title_format, shared_datasourceholoviews.plotting.bokeh.element.ElementPlot: fontsize, toolbar, width, height, active_tools, align, border, aspect, data_aspect, frame_width, frame_height, min_width, min_height, max_width, max_height, margin, responsive, gridstyle, labelled, lod, show_frame, shared_axes, default_tools, tools, xformatter, yformatterholoviews.plotting.bokeh.element.ColorbarPlot: color_levels, clabel, clim, cformatter, colorbar, colorbar_position, colorbar_opts, clipping_colors, logz, symmetricselected= param.List(bounds=(0, None))The current selection as a list of integers corresponding to the selected items.
-
cleanup()¶ Cleans up references to the plot after the plot has been deleted. Traverses through all plots cleaning up Callbacks and Stream subscribers.
-
compute_ranges(obj, key, ranges)¶ Given an object, a specific key, and the normalization options, this method will find the specified normalization options on the appropriate OptionTree, group the elements according to the selected normalization option (i.e. either per frame or over the whole animation) and finally compute the dimension ranges in each group. The new set of ranges is returned.
-
property
current_handles¶ Should return a list of plot objects that have changed and should be updated.
-
property
framewise¶ Property to determine whether the current frame should have framewise normalization enabled. Required for bokeh plotting classes to determine whether to send updated ranges for each frame.
-
get_aspect(xspan, yspan)¶ Computes the aspect ratio of the plot
-
get_data(element, ranges, style)[source]¶ Returns the data from an element in the appropriate format for initializing or updating a ColumnDataSource and a dictionary which maps the expected keywords arguments of a glyph to the column in the datasource.
-
get_extents(element, ranges, range_type='combined', xdim=None, ydim=None, zdim=None)¶ Gets the extents for the axes from the current Element. The globally computed ranges can optionally override the extents.
The extents are computed by combining the data ranges, extents and dimension ranges. Each of these can be obtained individually by setting the range_type to one of:
‘data’: Just the data ranges
‘extents’: Element.extents
‘soft’: Dimension.soft_range values
‘hard’: Dimension.range values
To obtain the combined range, which includes range padding the default may be used:
‘combined’: All the range types combined and padding applied
This allows Overlay plots to obtain each range and combine them appropriately for all the objects in the overlay.
-
get_padding(obj, extents)¶ Computes padding along the axes taking into account the plot aspect.
-
get_zorder(overlay, key, el)¶ Computes the z-order of element in the NdOverlay taking into account possible batching of elements.
-
initialize_plot(ranges=None, plot=None, plots=None, source=None)¶ Initializes a new plot object with the last available frame.
-
property
link_sources¶ Returns potential Link or Stream sources.
-
matches(spec)¶ Matches a specification against the current Plot.
-
model_changed(model)¶ Determines if the bokeh model was just changed on the frontend. Useful to suppress boomeranging events, e.g. when the frontend just sent an update to the x_range this should not trigger an update on the backend.
-
push()¶ Pushes plot updates to the frontend.
-
refresh(**kwargs)¶ Refreshes the plot by rerendering it and then pushing the updated data if the plot has an associated Comm.
-
set_root(root)¶ Sets the root model on all subplots.
-
property
state¶ The plotting state that gets updated via the update method and used by the renderer to generate output.
-
sync_sources()¶ Syncs data sources between Elements, which draw data from the same object.
-
traverse(fn=None, specs=None, full_breadth=True)¶ Traverses any nested DimensionedPlot returning a list of all plots that match the specs. The specs should be supplied as a list of either Plot types or callables, which should return a boolean given the plot class.
-
update(key)¶ Update the internal state of the Plot to represent the given key tuple (where integers represent frames). Returns this state.
-
update_frame(key, ranges=None, plot=None, element=None)¶ Updates an existing plot with data corresponding to the key.
-
class
holoviews.plotting.bokeh.chart.HistogramPlot(element, plot=None, **params)[source]¶ Bases:
holoviews.plotting.bokeh.element.ColorbarPlotParameters inherited from:
holoviews.plotting.plot.DimensionedPlot: fontscale, show_title, normalize, projectionholoviews.plotting.plot.GenericElementPlot: apply_ranges, apply_extents, bgcolor, default_span, hooks, invert_axes, invert_xaxis, invert_yaxis, finalize_hooks, logx, logy, padding, show_legend, show_grid, xaxis, yaxis, xlabel, ylabel, xlim, ylim, zlim, xrotation, yrotation, xticks, yticksholoviews.plotting.bokeh.plot.BokehPlot: title, title_format, shared_datasourceholoviews.plotting.bokeh.element.ElementPlot: fontsize, toolbar, width, height, active_tools, align, border, aspect, data_aspect, frame_width, frame_height, min_width, min_height, max_width, max_height, margin, responsive, gridstyle, labelled, lod, show_frame, shared_axes, default_tools, tools, xformatter, yformatterholoviews.plotting.bokeh.element.ColorbarPlot: color_levels, clabel, clim, cformatter, colorbar, colorbar_position, colorbar_opts, clipping_colors, logz, symmetric-
cleanup()¶ Cleans up references to the plot after the plot has been deleted. Traverses through all plots cleaning up Callbacks and Stream subscribers.
-
compute_ranges(obj, key, ranges)¶ Given an object, a specific key, and the normalization options, this method will find the specified normalization options on the appropriate OptionTree, group the elements according to the selected normalization option (i.e. either per frame or over the whole animation) and finally compute the dimension ranges in each group. The new set of ranges is returned.
-
property
current_handles¶ Should return a list of plot objects that have changed and should be updated.
-
property
framewise¶ Property to determine whether the current frame should have framewise normalization enabled. Required for bokeh plotting classes to determine whether to send updated ranges for each frame.
-
get_aspect(xspan, yspan)¶ Computes the aspect ratio of the plot
-
get_data(element, ranges, style)[source]¶ Returns the data from an element in the appropriate format for initializing or updating a ColumnDataSource and a dictionary which maps the expected keywords arguments of a glyph to the column in the datasource.
-
get_extents(element, ranges, range_type='combined')[source]¶ Gets the extents for the axes from the current Element. The globally computed ranges can optionally override the extents.
The extents are computed by combining the data ranges, extents and dimension ranges. Each of these can be obtained individually by setting the range_type to one of:
‘data’: Just the data ranges
‘extents’: Element.extents
‘soft’: Dimension.soft_range values
‘hard’: Dimension.range values
To obtain the combined range, which includes range padding the default may be used:
‘combined’: All the range types combined and padding applied
This allows Overlay plots to obtain each range and combine them appropriately for all the objects in the overlay.
-
get_padding(obj, extents)¶ Computes padding along the axes taking into account the plot aspect.
-
get_zorder(overlay, key, el)¶ Computes the z-order of element in the NdOverlay taking into account possible batching of elements.
-
initialize_plot(ranges=None, plot=None, plots=None, source=None)¶ Initializes a new plot object with the last available frame.
-
property
link_sources¶ Returns potential Link or Stream sources.
-
matches(spec)¶ Matches a specification against the current Plot.
-
model_changed(model)¶ Determines if the bokeh model was just changed on the frontend. Useful to suppress boomeranging events, e.g. when the frontend just sent an update to the x_range this should not trigger an update on the backend.
-
push()¶ Pushes plot updates to the frontend.
-
refresh(**kwargs)¶ Refreshes the plot by rerendering it and then pushing the updated data if the plot has an associated Comm.
-
set_root(root)¶ Sets the root model on all subplots.
-
property
state¶ The plotting state that gets updated via the update method and used by the renderer to generate output.
-
sync_sources()¶ Syncs data sources between Elements, which draw data from the same object.
-
traverse(fn=None, specs=None, full_breadth=True)¶ Traverses any nested DimensionedPlot returning a list of all plots that match the specs. The specs should be supplied as a list of either Plot types or callables, which should return a boolean given the plot class.
-
update(key)¶ Update the internal state of the Plot to represent the given key tuple (where integers represent frames). Returns this state.
-
update_frame(key, ranges=None, plot=None, element=None)¶ Updates an existing plot with data corresponding to the key.
-
-
class
holoviews.plotting.bokeh.chart.PointPlot(element, plot=None, **params)[source]¶ Bases:
holoviews.plotting.bokeh.element.LegendPlot,holoviews.plotting.bokeh.element.ColorbarPlotParameters inherited from:
holoviews.plotting.plot.DimensionedPlot: fontscale, show_title, normalize, projectionholoviews.plotting.plot.GenericElementPlot: apply_ranges, apply_extents, bgcolor, default_span, hooks, invert_axes, invert_xaxis, invert_yaxis, finalize_hooks, logx, logy, padding, show_legend, show_grid, xaxis, yaxis, xlabel, ylabel, xlim, ylim, zlim, xrotation, yrotation, xticks, yticksholoviews.plotting.bokeh.plot.BokehPlot: title, title_format, shared_datasourceholoviews.plotting.bokeh.element.ElementPlot: fontsize, toolbar, width, height, active_tools, align, border, aspect, data_aspect, frame_width, frame_height, min_width, min_height, max_width, max_height, margin, responsive, gridstyle, labelled, lod, show_frame, shared_axes, default_tools, tools, xformatter, yformatterholoviews.plotting.bokeh.element.ColorbarPlot: color_levels, clabel, clim, cformatter, colorbar, colorbar_position, colorbar_opts, clipping_colors, logz, symmetricholoviews.plotting.bokeh.element.LegendPlot: legend_position, legend_muted, legend_offset, legend_cols, legend_optsjitter= param.Number(bounds=(0, None), inclusive_bounds=(True, True))The amount of jitter to apply to offset the points along the x-axis.
selected= param.List(bounds=(0, None))The current selection as a list of integers corresponding to the selected items.
color_index= param.ClassSelector(class_=(<class ‘str’>, <class ‘int’>))Deprecated in favor of color style mapping, e.g. color=dim(‘color’)
size_index= param.ClassSelector(class_=(<class ‘str’>, <class ‘int’>))Deprecated in favor of size style mapping, e.g. size=dim(‘size’)
scaling_method= param.ObjectSelector(default=’area’, objects=[‘width’, ‘area’])Deprecated in favor of size style mapping, e.g. size=dim(‘size’)**2.
scaling_factor= param.Number(bounds=(0, None), default=1, inclusive_bounds=(True, True))Scaling factor which is applied to either the width or area of each point, depending on the value of scaling_method.
size_fn= param.Callable(default=<ufunc ‘absolute’>)Function applied to size values before applying scaling, to remove values lower than zero.
-
cleanup()¶ Cleans up references to the plot after the plot has been deleted. Traverses through all plots cleaning up Callbacks and Stream subscribers.
-
compute_ranges(obj, key, ranges)¶ Given an object, a specific key, and the normalization options, this method will find the specified normalization options on the appropriate OptionTree, group the elements according to the selected normalization option (i.e. either per frame or over the whole animation) and finally compute the dimension ranges in each group. The new set of ranges is returned.
-
property
current_handles¶ Should return a list of plot objects that have changed and should be updated.
-
property
framewise¶ Property to determine whether the current frame should have framewise normalization enabled. Required for bokeh plotting classes to determine whether to send updated ranges for each frame.
-
get_aspect(xspan, yspan)¶ Computes the aspect ratio of the plot
-
get_data(element, ranges, style)[source]¶ Returns the data from an element in the appropriate format for initializing or updating a ColumnDataSource and a dictionary which maps the expected keywords arguments of a glyph to the column in the datasource.
-
get_extents(element, ranges, range_type='combined', xdim=None, ydim=None, zdim=None)¶ Gets the extents for the axes from the current Element. The globally computed ranges can optionally override the extents.
The extents are computed by combining the data ranges, extents and dimension ranges. Each of these can be obtained individually by setting the range_type to one of:
‘data’: Just the data ranges
‘extents’: Element.extents
‘soft’: Dimension.soft_range values
‘hard’: Dimension.range values
To obtain the combined range, which includes range padding the default may be used:
‘combined’: All the range types combined and padding applied
This allows Overlay plots to obtain each range and combine them appropriately for all the objects in the overlay.
-
get_padding(obj, extents)¶ Computes padding along the axes taking into account the plot aspect.
-
get_zorder(overlay, key, el)¶ Computes the z-order of element in the NdOverlay taking into account possible batching of elements.
-
initialize_plot(ranges=None, plot=None, plots=None, source=None)¶ Initializes a new plot object with the last available frame.
-
property
link_sources¶ Returns potential Link or Stream sources.
-
matches(spec)¶ Matches a specification against the current Plot.
-
model_changed(model)¶ Determines if the bokeh model was just changed on the frontend. Useful to suppress boomeranging events, e.g. when the frontend just sent an update to the x_range this should not trigger an update on the backend.
-
push()¶ Pushes plot updates to the frontend.
-
refresh(**kwargs)¶ Refreshes the plot by rerendering it and then pushing the updated data if the plot has an associated Comm.
-
set_root(root)¶ Sets the root model on all subplots.
-
size_fn= <ufunc 'absolute'>
-
property
state¶ The plotting state that gets updated via the update method and used by the renderer to generate output.
-
sync_sources()¶ Syncs data sources between Elements, which draw data from the same object.
-
traverse(fn=None, specs=None, full_breadth=True)¶ Traverses any nested DimensionedPlot returning a list of all plots that match the specs. The specs should be supplied as a list of either Plot types or callables, which should return a boolean given the plot class.
-
update(key)¶ Update the internal state of the Plot to represent the given key tuple (where integers represent frames). Returns this state.
-
update_frame(key, ranges=None, plot=None, element=None)¶ Updates an existing plot with data corresponding to the key.
-
class
holoviews.plotting.bokeh.chart.SideHistogramPlot(*args, **kwargs)[source]¶ Bases:
holoviews.plotting.bokeh.chart.HistogramPlotParameters inherited from:
holoviews.plotting.plot.DimensionedPlot: fontscale, normalize, projectionholoviews.plotting.plot.GenericElementPlot: apply_ranges, apply_extents, bgcolor, default_span, hooks, invert_axes, invert_xaxis, invert_yaxis, finalize_hooks, logx, logy, padding, show_legend, show_grid, xaxis, yaxis, xlabel, ylabel, xlim, ylim, zlim, xrotation, yrotation, xticks, yticksholoviews.plotting.bokeh.plot.BokehPlot: title, title_format, shared_datasourceholoviews.plotting.bokeh.element.ElementPlot: fontsize, toolbar, active_tools, align, border, aspect, data_aspect, frame_width, frame_height, min_width, min_height, max_width, max_height, margin, responsive, gridstyle, labelled, lod, show_frame, shared_axes, tools, xformatter, yformatterholoviews.plotting.bokeh.element.ColorbarPlot: color_levels, clabel, clim, cformatter, colorbar, colorbar_position, colorbar_opts, clipping_colors, logz, symmetricshow_title= param.Boolean(bounds=(0, 1), default=False)Whether to display the plot title.
width= param.Integer(bounds=(0, None), default=125, inclusive_bounds=(True, True))The width of the plot
height= param.Integer(bounds=(0, None), default=125, inclusive_bounds=(True, True))The height of the plot
default_tools= param.List(bounds=(0, None), default=[‘save’, ‘pan’, ‘wheel_zoom’, ‘box_zoom’, ‘reset’])A list of plugin tools to use on the plot.
-
cleanup()¶ Cleans up references to the plot after the plot has been deleted. Traverses through all plots cleaning up Callbacks and Stream subscribers.
-
compute_ranges(obj, key, ranges)¶ Given an object, a specific key, and the normalization options, this method will find the specified normalization options on the appropriate OptionTree, group the elements according to the selected normalization option (i.e. either per frame or over the whole animation) and finally compute the dimension ranges in each group. The new set of ranges is returned.
-
property
current_handles¶ Should return a list of plot objects that have changed and should be updated.
-
property
framewise¶ Property to determine whether the current frame should have framewise normalization enabled. Required for bokeh plotting classes to determine whether to send updated ranges for each frame.
-
get_aspect(xspan, yspan)¶ Computes the aspect ratio of the plot
-
get_data(element, ranges, style)[source]¶ Returns the data from an element in the appropriate format for initializing or updating a ColumnDataSource and a dictionary which maps the expected keywords arguments of a glyph to the column in the datasource.
-
get_extents(element, ranges, range_type='combined')¶ Gets the extents for the axes from the current Element. The globally computed ranges can optionally override the extents.
The extents are computed by combining the data ranges, extents and dimension ranges. Each of these can be obtained individually by setting the range_type to one of:
‘data’: Just the data ranges
‘extents’: Element.extents
‘soft’: Dimension.soft_range values
‘hard’: Dimension.range values
To obtain the combined range, which includes range padding the default may be used:
‘combined’: All the range types combined and padding applied
This allows Overlay plots to obtain each range and combine them appropriately for all the objects in the overlay.
-
get_padding(obj, extents)¶ Computes padding along the axes taking into account the plot aspect.
-
get_zorder(overlay, key, el)¶ Computes the z-order of element in the NdOverlay taking into account possible batching of elements.
-
initialize_plot(ranges=None, plot=None, plots=None, source=None)¶ Initializes a new plot object with the last available frame.
-
property
link_sources¶ Returns potential Link or Stream sources.
-
matches(spec)¶ Matches a specification against the current Plot.
-
model_changed(model)¶ Determines if the bokeh model was just changed on the frontend. Useful to suppress boomeranging events, e.g. when the frontend just sent an update to the x_range this should not trigger an update on the backend.
-
push()¶ Pushes plot updates to the frontend.
-
refresh(**kwargs)¶ Refreshes the plot by rerendering it and then pushing the updated data if the plot has an associated Comm.
-
set_root(root)¶ Sets the root model on all subplots.
-
property
state¶ The plotting state that gets updated via the update method and used by the renderer to generate output.
-
sync_sources()¶ Syncs data sources between Elements, which draw data from the same object.
-
traverse(fn=None, specs=None, full_breadth=True)¶ Traverses any nested DimensionedPlot returning a list of all plots that match the specs. The specs should be supplied as a list of either Plot types or callables, which should return a boolean given the plot class.
-
update(key)¶ Update the internal state of the Plot to represent the given key tuple (where integers represent frames). Returns this state.
-
update_frame(key, ranges=None, plot=None, element=None)¶ Updates an existing plot with data corresponding to the key.
-
class
holoviews.plotting.bokeh.chart.SideSpikesPlot(element, plot=None, **params)[source]¶ Bases:
holoviews.plotting.bokeh.chart.SpikesPlotSpikesPlot with useful defaults for plotting adjoined rug plot.
Parameters inherited from:
holoviews.plotting.plot.DimensionedPlot: fontscale, show_title, normalize, projectionholoviews.plotting.plot.GenericElementPlot: apply_ranges, apply_extents, bgcolor, default_span, hooks, invert_axes, invert_xaxis, invert_yaxis, finalize_hooks, logx, logy, padding, show_grid, xlabel, ylabel, xlim, ylim, zlim, xrotation, yrotation, xticks, yticksholoviews.plotting.bokeh.plot.BokehPlot: title, title_format, shared_datasourceholoviews.plotting.bokeh.element.ElementPlot: fontsize, toolbar, active_tools, align, aspect, data_aspect, frame_width, frame_height, min_width, min_height, max_width, max_height, margin, responsive, gridstyle, labelled, lod, show_frame, shared_axes, default_tools, tools, xformatter, yformatterholoviews.plotting.bokeh.element.ColorbarPlot: color_levels, clabel, clim, cformatter, colorbar, colorbar_position, colorbar_opts, clipping_colors, logz, symmetricholoviews.plotting.bokeh.chart.SpikesPlot: show_legend, spike_length, position, color_indexxaxis= param.ObjectSelector(default=’top-bare’, objects=[‘top’, ‘bottom’, ‘bare’, ‘top-bare’, ‘bottom-bare’, None])Whether and where to display the xaxis, bare options allow suppressing all axis labels including ticks and xlabel. Valid options are ‘top’, ‘bottom’, ‘bare’, ‘top-bare’ and ‘bottom-bare’.
yaxis= param.ObjectSelector(default=’right-bare’, objects=[‘left’, ‘right’, ‘bare’, ‘left-bare’, ‘right-bare’, None])Whether and where to display the yaxis, bare options allow suppressing all axis labels including ticks and ylabel. Valid options are ‘left’, ‘right’, ‘bare’ ‘left-bare’ and ‘right-bare’.
width= param.Integer(bounds=(0, None), default=50, inclusive_bounds=(True, True))Width of plot
height= param.Integer(bounds=(0, None), default=50, inclusive_bounds=(True, True))Height of plot
border= param.Integer(default=5, inclusive_bounds=(True, True))Default borders on plot
selected= param.List(bounds=(0, None))The current selection as a list of integers corresponding to the selected items.
-
cleanup()¶ Cleans up references to the plot after the plot has been deleted. Traverses through all plots cleaning up Callbacks and Stream subscribers.
-
compute_ranges(obj, key, ranges)¶ Given an object, a specific key, and the normalization options, this method will find the specified normalization options on the appropriate OptionTree, group the elements according to the selected normalization option (i.e. either per frame or over the whole animation) and finally compute the dimension ranges in each group. The new set of ranges is returned.
-
property
current_handles¶ Should return a list of plot objects that have changed and should be updated.
-
property
framewise¶ Property to determine whether the current frame should have framewise normalization enabled. Required for bokeh plotting classes to determine whether to send updated ranges for each frame.
-
get_aspect(xspan, yspan)¶ Computes the aspect ratio of the plot
-
get_data(element, ranges, style)¶ Returns the data from an element in the appropriate format for initializing or updating a ColumnDataSource and a dictionary which maps the expected keywords arguments of a glyph to the column in the datasource.
-
get_padding(obj, extents)¶ Computes padding along the axes taking into account the plot aspect.
-
get_zorder(overlay, key, el)¶ Computes the z-order of element in the NdOverlay taking into account possible batching of elements.
-
initialize_plot(ranges=None, plot=None, plots=None, source=None)¶ Initializes a new plot object with the last available frame.
-
property
link_sources¶ Returns potential Link or Stream sources.
-
matches(spec)¶ Matches a specification against the current Plot.
-
model_changed(model)¶ Determines if the bokeh model was just changed on the frontend. Useful to suppress boomeranging events, e.g. when the frontend just sent an update to the x_range this should not trigger an update on the backend.
-
push()¶ Pushes plot updates to the frontend.
-
refresh(**kwargs)¶ Refreshes the plot by rerendering it and then pushing the updated data if the plot has an associated Comm.
-
set_root(root)¶ Sets the root model on all subplots.
-
property
state¶ The plotting state that gets updated via the update method and used by the renderer to generate output.
-
sync_sources()¶ Syncs data sources between Elements, which draw data from the same object.
-
traverse(fn=None, specs=None, full_breadth=True)¶ Traverses any nested DimensionedPlot returning a list of all plots that match the specs. The specs should be supplied as a list of either Plot types or callables, which should return a boolean given the plot class.
-
update(key)¶ Update the internal state of the Plot to represent the given key tuple (where integers represent frames). Returns this state.
-
update_frame(key, ranges=None, plot=None, element=None)¶ Updates an existing plot with data corresponding to the key.
-
class
holoviews.plotting.bokeh.chart.SpikesPlot(element, plot=None, **params)[source]¶ Bases:
holoviews.plotting.mixins.SpikesMixin,holoviews.plotting.bokeh.element.ColorbarPlotParameters inherited from:
holoviews.plotting.plot.DimensionedPlot: fontscale, show_title, normalize, projectionholoviews.plotting.plot.GenericElementPlot: apply_ranges, apply_extents, bgcolor, default_span, hooks, invert_axes, invert_xaxis, invert_yaxis, finalize_hooks, logx, logy, padding, show_grid, xaxis, yaxis, xlabel, ylabel, xlim, ylim, zlim, xrotation, yrotation, xticks, yticksholoviews.plotting.bokeh.plot.BokehPlot: title, title_format, shared_datasourceholoviews.plotting.bokeh.element.ElementPlot: fontsize, toolbar, width, height, active_tools, align, border, aspect, data_aspect, frame_width, frame_height, min_width, min_height, max_width, max_height, margin, responsive, gridstyle, labelled, lod, show_frame, shared_axes, default_tools, tools, xformatter, yformatterholoviews.plotting.bokeh.element.ColorbarPlot: color_levels, clabel, clim, cformatter, colorbar, colorbar_position, colorbar_opts, clipping_colors, logz, symmetricshow_legend= param.Boolean(bounds=(0, 1), default=True)Whether to show legend for the plot.
spike_length= param.Number(default=0.5, inclusive_bounds=(True, True))The length of each spike if Spikes object is one dimensional.
position= param.Number(default=0.0, inclusive_bounds=(True, True))The position of the lower end of each spike.
color_index= param.ClassSelector(class_=(<class ‘str’>, <class ‘int’>))Deprecated in favor of color style mapping, e.g. color=dim(‘color’)
-
cleanup()¶ Cleans up references to the plot after the plot has been deleted. Traverses through all plots cleaning up Callbacks and Stream subscribers.
-
compute_ranges(obj, key, ranges)¶ Given an object, a specific key, and the normalization options, this method will find the specified normalization options on the appropriate OptionTree, group the elements according to the selected normalization option (i.e. either per frame or over the whole animation) and finally compute the dimension ranges in each group. The new set of ranges is returned.
-
property
current_handles¶ Should return a list of plot objects that have changed and should be updated.
-
property
framewise¶ Property to determine whether the current frame should have framewise normalization enabled. Required for bokeh plotting classes to determine whether to send updated ranges for each frame.
-
get_aspect(xspan, yspan)¶ Computes the aspect ratio of the plot
-
get_data(element, ranges, style)[source]¶ Returns the data from an element in the appropriate format for initializing or updating a ColumnDataSource and a dictionary which maps the expected keywords arguments of a glyph to the column in the datasource.
-
get_padding(obj, extents)¶ Computes padding along the axes taking into account the plot aspect.
-
get_zorder(overlay, key, el)¶ Computes the z-order of element in the NdOverlay taking into account possible batching of elements.
-
initialize_plot(ranges=None, plot=None, plots=None, source=None)¶ Initializes a new plot object with the last available frame.
-
property
link_sources¶ Returns potential Link or Stream sources.
-
matches(spec)¶ Matches a specification against the current Plot.
-
model_changed(model)¶ Determines if the bokeh model was just changed on the frontend. Useful to suppress boomeranging events, e.g. when the frontend just sent an update to the x_range this should not trigger an update on the backend.
-
push()¶ Pushes plot updates to the frontend.
-
refresh(**kwargs)¶ Refreshes the plot by rerendering it and then pushing the updated data if the plot has an associated Comm.
-
set_root(root)¶ Sets the root model on all subplots.
-
property
state¶ The plotting state that gets updated via the update method and used by the renderer to generate output.
-
sync_sources()¶ Syncs data sources between Elements, which draw data from the same object.
-
traverse(fn=None, specs=None, full_breadth=True)¶ Traverses any nested DimensionedPlot returning a list of all plots that match the specs. The specs should be supplied as a list of either Plot types or callables, which should return a boolean given the plot class.
-
update(key)¶ Update the internal state of the Plot to represent the given key tuple (where integers represent frames). Returns this state.
-
update_frame(key, ranges=None, plot=None, element=None)¶ Updates an existing plot with data corresponding to the key.
-
class
holoviews.plotting.bokeh.chart.SpreadPlot(element, plot=None, **params)[source]¶ Bases:
holoviews.plotting.bokeh.element.ElementPlotParameters inherited from:
holoviews.plotting.plot.DimensionedPlot: fontscale, show_title, normalize, projectionholoviews.plotting.plot.GenericElementPlot: apply_ranges, apply_extents, bgcolor, default_span, hooks, invert_axes, invert_xaxis, invert_yaxis, finalize_hooks, logx, logy, show_legend, show_grid, xaxis, yaxis, xlabel, ylabel, xlim, ylim, zlim, xrotation, yrotation, xticks, yticksholoviews.plotting.bokeh.plot.BokehPlot: title, title_format, shared_datasourceholoviews.plotting.bokeh.element.ElementPlot: fontsize, toolbar, width, height, active_tools, align, border, aspect, data_aspect, frame_width, frame_height, min_width, min_height, max_width, max_height, margin, responsive, gridstyle, labelled, lod, show_frame, shared_axes, default_tools, tools, xformatter, yformatterpadding= param.ClassSelector(class_=(<class ‘int’>, <class ‘float’>, <class ‘tuple’>), default=(0, 0.1))Fraction by which to increase auto-ranged extents to make datapoints more visible around borders. To compute padding, the axis whose screen size is largest is chosen, and the range of that axis is increased by the specified fraction along each axis. Other axes are then padded ensuring that the amount of screen space devoted to padding is equal for all axes. If specified as a tuple, the int or float values in the tuple will be used for padding in each axis, in order (x,y or x,y,z). For example, for padding=0.2 on a 800x800-pixel plot, an x-axis with the range [0,10] will be padded by 20% to be [-1,11], while a y-axis with a range [0,1000] will be padded to be [-100,1100], which should make the padding be approximately the same number of pixels. But if the same plot is changed to have a height of only 200, the y-range will then be [-400,1400] so that the y-axis padding will still match that of the x-axis. It is also possible to declare non-equal padding value for the lower and upper bound of an axis by supplying nested tuples, e.g. padding=(0.1, (0, 0.1)) will pad the x-axis lower and upper bound as well as the y-axis upper bound by a fraction of 0.1 while the y-axis lower bound is not padded at all.
-
cleanup()¶ Cleans up references to the plot after the plot has been deleted. Traverses through all plots cleaning up Callbacks and Stream subscribers.
-
compute_ranges(obj, key, ranges)¶ Given an object, a specific key, and the normalization options, this method will find the specified normalization options on the appropriate OptionTree, group the elements according to the selected normalization option (i.e. either per frame or over the whole animation) and finally compute the dimension ranges in each group. The new set of ranges is returned.
-
property
current_handles¶ Should return a list of plot objects that have changed and should be updated.
-
property
framewise¶ Property to determine whether the current frame should have framewise normalization enabled. Required for bokeh plotting classes to determine whether to send updated ranges for each frame.
-
get_aspect(xspan, yspan)¶ Computes the aspect ratio of the plot
-
get_data(element, ranges, style)[source]¶ Returns the data from an element in the appropriate format for initializing or updating a ColumnDataSource and a dictionary which maps the expected keywords arguments of a glyph to the column in the datasource.
-
get_extents(element, ranges, range_type='combined', xdim=None, ydim=None, zdim=None)¶ Gets the extents for the axes from the current Element. The globally computed ranges can optionally override the extents.
The extents are computed by combining the data ranges, extents and dimension ranges. Each of these can be obtained individually by setting the range_type to one of:
‘data’: Just the data ranges
‘extents’: Element.extents
‘soft’: Dimension.soft_range values
‘hard’: Dimension.range values
To obtain the combined range, which includes range padding the default may be used:
‘combined’: All the range types combined and padding applied
This allows Overlay plots to obtain each range and combine them appropriately for all the objects in the overlay.
-
get_padding(obj, extents)¶ Computes padding along the axes taking into account the plot aspect.
-
get_zorder(overlay, key, el)¶ Computes the z-order of element in the NdOverlay taking into account possible batching of elements.
-
initialize_plot(ranges=None, plot=None, plots=None, source=None)¶ Initializes a new plot object with the last available frame.
-
property
link_sources¶ Returns potential Link or Stream sources.
-
matches(spec)¶ Matches a specification against the current Plot.
-
model_changed(model)¶ Determines if the bokeh model was just changed on the frontend. Useful to suppress boomeranging events, e.g. when the frontend just sent an update to the x_range this should not trigger an update on the backend.
-
push()¶ Pushes plot updates to the frontend.
-
refresh(**kwargs)¶ Refreshes the plot by rerendering it and then pushing the updated data if the plot has an associated Comm.
-
set_root(root)¶ Sets the root model on all subplots.
-
property
state¶ The plotting state that gets updated via the update method and used by the renderer to generate output.
-
sync_sources()¶ Syncs data sources between Elements, which draw data from the same object.
-
traverse(fn=None, specs=None, full_breadth=True)¶ Traverses any nested DimensionedPlot returning a list of all plots that match the specs. The specs should be supplied as a list of either Plot types or callables, which should return a boolean given the plot class.
-
update(key)¶ Update the internal state of the Plot to represent the given key tuple (where integers represent frames). Returns this state.
-
update_frame(key, ranges=None, plot=None, element=None)¶ Updates an existing plot with data corresponding to the key.
-
class
holoviews.plotting.bokeh.chart.VectorFieldPlot(element, plot=None, **params)[source]¶ Bases:
holoviews.plotting.bokeh.element.ColorbarPlotParameters inherited from:
holoviews.plotting.plot.DimensionedPlot: fontscale, show_title, normalize, projectionholoviews.plotting.plot.GenericElementPlot: apply_ranges, apply_extents, bgcolor, default_span, hooks, invert_axes, invert_xaxis, invert_yaxis, finalize_hooks, logx, logy, show_legend, show_grid, xaxis, yaxis, xlabel, ylabel, xlim, ylim, zlim, xrotation, yrotation, xticks, yticksholoviews.plotting.bokeh.plot.BokehPlot: title, title_format, shared_datasourceholoviews.plotting.bokeh.element.ElementPlot: fontsize, toolbar, width, height, active_tools, align, border, aspect, data_aspect, frame_width, frame_height, min_width, min_height, max_width, max_height, margin, responsive, gridstyle, labelled, lod, show_frame, shared_axes, default_tools, tools, xformatter, yformatterholoviews.plotting.bokeh.element.ColorbarPlot: color_levels, clabel, clim, cformatter, colorbar, colorbar_position, colorbar_opts, clipping_colors, logz, symmetricpadding= param.ClassSelector(class_=(<class ‘int’>, <class ‘float’>, <class ‘tuple’>), default=0.05)Fraction by which to increase auto-ranged extents to make datapoints more visible around borders. To compute padding, the axis whose screen size is largest is chosen, and the range of that axis is increased by the specified fraction along each axis. Other axes are then padded ensuring that the amount of screen space devoted to padding is equal for all axes. If specified as a tuple, the int or float values in the tuple will be used for padding in each axis, in order (x,y or x,y,z). For example, for padding=0.2 on a 800x800-pixel plot, an x-axis with the range [0,10] will be padded by 20% to be [-1,11], while a y-axis with a range [0,1000] will be padded to be [-100,1100], which should make the padding be approximately the same number of pixels. But if the same plot is changed to have a height of only 200, the y-range will then be [-400,1400] so that the y-axis padding will still match that of the x-axis. It is also possible to declare non-equal padding value for the lower and upper bound of an axis by supplying nested tuples, e.g. padding=(0.1, (0, 0.1)) will pad the x-axis lower and upper bound as well as the y-axis upper bound by a fraction of 0.1 while the y-axis lower bound is not padded at all.
arrow_heads= param.Boolean(bounds=(0, 1), default=True)Whether or not to draw arrow heads.
magnitude= param.ClassSelector(class_=(<class ‘str’>, <class ‘holoviews.util.transform.dim’>))Dimension or dimension value transform that declares the magnitude of each vector. Magnitude is expected to be scaled between 0-1, by default the magnitudes are rescaled relative to the minimum distance between vectors, this can be disabled with the rescale_lengths option.
pivot= param.ObjectSelector(default=’mid’, objects=[‘mid’, ‘tip’, ‘tail’])The point around which the arrows should pivot valid options include ‘mid’, ‘tip’ and ‘tail’.
rescale_lengths= param.Boolean(bounds=(0, 1), default=True)Whether the lengths will be rescaled to take into account the smallest non-zero distance between two vectors.
color_index= param.ClassSelector(class_=(<class ‘str’>, <class ‘int’>))Deprecated in favor of dimension value transform on color option, e.g. color=dim(‘Magnitude’).
size_index= param.ClassSelector(class_=(<class ‘str’>, <class ‘int’>))Deprecated in favor of the magnitude option, e.g. magnitude=dim(‘Magnitude’).
normalize_lengths= param.Boolean(bounds=(0, 1), default=True)Deprecated in favor of rescaling length using dimension value transforms using the magnitude option, e.g. dim(‘Magnitude’).norm().
-
cleanup()¶ Cleans up references to the plot after the plot has been deleted. Traverses through all plots cleaning up Callbacks and Stream subscribers.
-
compute_ranges(obj, key, ranges)¶ Given an object, a specific key, and the normalization options, this method will find the specified normalization options on the appropriate OptionTree, group the elements according to the selected normalization option (i.e. either per frame or over the whole animation) and finally compute the dimension ranges in each group. The new set of ranges is returned.
-
property
current_handles¶ Should return a list of plot objects that have changed and should be updated.
-
property
framewise¶ Property to determine whether the current frame should have framewise normalization enabled. Required for bokeh plotting classes to determine whether to send updated ranges for each frame.
-
get_aspect(xspan, yspan)¶ Computes the aspect ratio of the plot
-
get_data(element, ranges, style)[source]¶ Returns the data from an element in the appropriate format for initializing or updating a ColumnDataSource and a dictionary which maps the expected keywords arguments of a glyph to the column in the datasource.
-
get_extents(element, ranges, range_type='combined', xdim=None, ydim=None, zdim=None)¶ Gets the extents for the axes from the current Element. The globally computed ranges can optionally override the extents.
The extents are computed by combining the data ranges, extents and dimension ranges. Each of these can be obtained individually by setting the range_type to one of:
‘data’: Just the data ranges
‘extents’: Element.extents
‘soft’: Dimension.soft_range values
‘hard’: Dimension.range values
To obtain the combined range, which includes range padding the default may be used:
‘combined’: All the range types combined and padding applied
This allows Overlay plots to obtain each range and combine them appropriately for all the objects in the overlay.
-
get_padding(obj, extents)¶ Computes padding along the axes taking into account the plot aspect.
-
get_zorder(overlay, key, el)¶ Computes the z-order of element in the NdOverlay taking into account possible batching of elements.
-
initialize_plot(ranges=None, plot=None, plots=None, source=None)¶ Initializes a new plot object with the last available frame.
-
property
link_sources¶ Returns potential Link or Stream sources.
-
matches(spec)¶ Matches a specification against the current Plot.
-
model_changed(model)¶ Determines if the bokeh model was just changed on the frontend. Useful to suppress boomeranging events, e.g. when the frontend just sent an update to the x_range this should not trigger an update on the backend.
-
push()¶ Pushes plot updates to the frontend.
-
refresh(**kwargs)¶ Refreshes the plot by rerendering it and then pushing the updated data if the plot has an associated Comm.
-
set_root(root)¶ Sets the root model on all subplots.
-
property
state¶ The plotting state that gets updated via the update method and used by the renderer to generate output.
-
sync_sources()¶ Syncs data sources between Elements, which draw data from the same object.
-
traverse(fn=None, specs=None, full_breadth=True)¶ Traverses any nested DimensionedPlot returning a list of all plots that match the specs. The specs should be supplied as a list of either Plot types or callables, which should return a boolean given the plot class.
-
update(key)¶ Update the internal state of the Plot to represent the given key tuple (where integers represent frames). Returns this state.
-
update_frame(key, ranges=None, plot=None, element=None)¶ Updates an existing plot with data corresponding to the key.
element Module

-
class
holoviews.plotting.bokeh.element.AnnotationPlot[source]¶ Bases:
objectMix-in plotting subclass for AnnotationPlots which do not have a legend.
-
class
holoviews.plotting.bokeh.element.ColorbarPlot(element, plot=None, **params)[source]¶ Bases:
holoviews.plotting.bokeh.element.ElementPlotColorbarPlot provides methods to create colormappers and colorbar models which can be added to a glyph. Additionally it provides parameters to control the position and other styling options of the colorbar. The default colorbar_position options are defined by the colorbar_specs, but may be overridden by the colorbar_opts.
Parameters inherited from:
holoviews.plotting.plot.DimensionedPlot: fontscale, show_title, normalize, projectionholoviews.plotting.plot.GenericElementPlot: apply_ranges, apply_extents, bgcolor, default_span, hooks, invert_axes, invert_xaxis, invert_yaxis, finalize_hooks, logx, logy, padding, show_legend, show_grid, xaxis, yaxis, xlabel, ylabel, xlim, ylim, zlim, xrotation, yrotation, xticks, yticksholoviews.plotting.bokeh.plot.BokehPlot: title, title_format, shared_datasourceholoviews.plotting.bokeh.element.ElementPlot: fontsize, toolbar, width, height, active_tools, align, border, aspect, data_aspect, frame_width, frame_height, min_width, min_height, max_width, max_height, margin, responsive, gridstyle, labelled, lod, show_frame, shared_axes, default_tools, tools, xformatter, yformattercolor_levels= param.ClassSelector(class_=(<class ‘int’>, <class ‘list’>, <class ‘range’>))Number of discrete colors to use when colormapping or a set of color intervals defining the range of values to map each color to.
clabel= param.String()An explicit override of the color bar label, if set takes precedence over the title key in colorbar_opts.
clim= param.Tuple(default=(nan, nan), length=2)User-specified colorbar axis range limits for the plot, as a tuple (low,high). If specified, takes precedence over data and dimension ranges.
cformatter= param.ClassSelector(class_=(<class ‘str’>, <class ‘bokeh.models.formatters.TickFormatter’>, <class ‘function’>))Formatter for ticks along the colorbar axis.
colorbar= param.Boolean(bounds=(0, 1), default=False)Whether to display a colorbar.
colorbar_position= param.ObjectSelector(default=’right’, objects=[‘right’, ‘left’, ‘bottom’, ‘top’, ‘top_right’, ‘top_left’, ‘bottom_left’, ‘bottom_right’])Allows selecting between a number of predefined colorbar position options. The predefined options may be customized in the colorbar_specs class attribute.
colorbar_opts= param.Dict(class_=<class ‘dict’>, default={})Allows setting specific styling options for the colorbar overriding the options defined in the colorbar_specs class attribute. Includes location, orientation, height, width, scale_alpha, title, title_props, margin, padding, background_fill_color and more.
clipping_colors= param.Dict(class_=<class ‘dict’>, default={})Dictionary to specify colors for clipped values, allows setting color for NaN values and for values above and below the min and max value. The min, max or NaN color may specify an RGB(A) color as a color hex string of the form #FFFFFF or #FFFFFFFF or a length 3 or length 4 tuple specifying values in the range 0-1 or a named HTML color.
logz= param.Boolean(bounds=(0, 1), default=False)Whether to apply log scaling to the z-axis.
symmetric= param.Boolean(bounds=(0, 1), default=False)Whether to make the colormap symmetric around zero.
-
cleanup()¶ Cleans up references to the plot after the plot has been deleted. Traverses through all plots cleaning up Callbacks and Stream subscribers.
-
compute_ranges(obj, key, ranges)¶ Given an object, a specific key, and the normalization options, this method will find the specified normalization options on the appropriate OptionTree, group the elements according to the selected normalization option (i.e. either per frame or over the whole animation) and finally compute the dimension ranges in each group. The new set of ranges is returned.
-
property
current_handles¶ Should return a list of plot objects that have changed and should be updated.
-
property
framewise¶ Property to determine whether the current frame should have framewise normalization enabled. Required for bokeh plotting classes to determine whether to send updated ranges for each frame.
-
get_aspect(xspan, yspan)¶ Computes the aspect ratio of the plot
-
get_data(element, ranges, style)¶ Returns the data from an element in the appropriate format for initializing or updating a ColumnDataSource and a dictionary which maps the expected keywords arguments of a glyph to the column in the datasource.
-
get_extents(element, ranges, range_type='combined', xdim=None, ydim=None, zdim=None)¶ Gets the extents for the axes from the current Element. The globally computed ranges can optionally override the extents.
The extents are computed by combining the data ranges, extents and dimension ranges. Each of these can be obtained individually by setting the range_type to one of:
‘data’: Just the data ranges
‘extents’: Element.extents
‘soft’: Dimension.soft_range values
‘hard’: Dimension.range values
To obtain the combined range, which includes range padding the default may be used:
‘combined’: All the range types combined and padding applied
This allows Overlay plots to obtain each range and combine them appropriately for all the objects in the overlay.
-
get_padding(obj, extents)¶ Computes padding along the axes taking into account the plot aspect.
-
get_zorder(overlay, key, el)¶ Computes the z-order of element in the NdOverlay taking into account possible batching of elements.
-
initialize_plot(ranges=None, plot=None, plots=None, source=None)¶ Initializes a new plot object with the last available frame.
-
property
link_sources¶ Returns potential Link or Stream sources.
-
matches(spec)¶ Matches a specification against the current Plot.
-
model_changed(model)¶ Determines if the bokeh model was just changed on the frontend. Useful to suppress boomeranging events, e.g. when the frontend just sent an update to the x_range this should not trigger an update on the backend.
-
push()¶ Pushes plot updates to the frontend.
-
refresh(**kwargs)¶ Refreshes the plot by rerendering it and then pushing the updated data if the plot has an associated Comm.
-
set_root(root)¶ Sets the root model on all subplots.
-
property
state¶ The plotting state that gets updated via the update method and used by the renderer to generate output.
-
sync_sources()¶ Syncs data sources between Elements, which draw data from the same object.
-
traverse(fn=None, specs=None, full_breadth=True)¶ Traverses any nested DimensionedPlot returning a list of all plots that match the specs. The specs should be supplied as a list of either Plot types or callables, which should return a boolean given the plot class.
-
update(key)¶ Update the internal state of the Plot to represent the given key tuple (where integers represent frames). Returns this state.
-
update_frame(key, ranges=None, plot=None, element=None)¶ Updates an existing plot with data corresponding to the key.
-
class
holoviews.plotting.bokeh.element.CompositeElementPlot(element, plot=None, **params)[source]¶ Bases:
holoviews.plotting.bokeh.element.ElementPlotA CompositeElementPlot is an Element plot type that coordinates drawing of multiple glyphs.
Parameters inherited from:
holoviews.plotting.plot.DimensionedPlot: fontscale, show_title, normalize, projectionholoviews.plotting.plot.GenericElementPlot: apply_ranges, apply_extents, bgcolor, default_span, hooks, invert_axes, invert_xaxis, invert_yaxis, finalize_hooks, logx, logy, padding, show_legend, show_grid, xaxis, yaxis, xlabel, ylabel, xlim, ylim, zlim, xrotation, yrotation, xticks, yticksholoviews.plotting.bokeh.plot.BokehPlot: title, title_format, shared_datasourceholoviews.plotting.bokeh.element.ElementPlot: fontsize, toolbar, width, height, active_tools, align, border, aspect, data_aspect, frame_width, frame_height, min_width, min_height, max_width, max_height, margin, responsive, gridstyle, labelled, lod, show_frame, shared_axes, default_tools, tools, xformatter, yformatter-
cleanup()¶ Cleans up references to the plot after the plot has been deleted. Traverses through all plots cleaning up Callbacks and Stream subscribers.
-
compute_ranges(obj, key, ranges)¶ Given an object, a specific key, and the normalization options, this method will find the specified normalization options on the appropriate OptionTree, group the elements according to the selected normalization option (i.e. either per frame or over the whole animation) and finally compute the dimension ranges in each group. The new set of ranges is returned.
-
property
current_handles¶ Should return a list of plot objects that have changed and should be updated.
-
property
framewise¶ Property to determine whether the current frame should have framewise normalization enabled. Required for bokeh plotting classes to determine whether to send updated ranges for each frame.
-
get_aspect(xspan, yspan)¶ Computes the aspect ratio of the plot
-
get_data(element, ranges, style)¶ Returns the data from an element in the appropriate format for initializing or updating a ColumnDataSource and a dictionary which maps the expected keywords arguments of a glyph to the column in the datasource.
-
get_extents(element, ranges, range_type='combined', xdim=None, ydim=None, zdim=None)¶ Gets the extents for the axes from the current Element. The globally computed ranges can optionally override the extents.
The extents are computed by combining the data ranges, extents and dimension ranges. Each of these can be obtained individually by setting the range_type to one of:
‘data’: Just the data ranges
‘extents’: Element.extents
‘soft’: Dimension.soft_range values
‘hard’: Dimension.range values
To obtain the combined range, which includes range padding the default may be used:
‘combined’: All the range types combined and padding applied
This allows Overlay plots to obtain each range and combine them appropriately for all the objects in the overlay.
-
get_padding(obj, extents)¶ Computes padding along the axes taking into account the plot aspect.
-
get_zorder(overlay, key, el)¶ Computes the z-order of element in the NdOverlay taking into account possible batching of elements.
-
initialize_plot(ranges=None, plot=None, plots=None, source=None)¶ Initializes a new plot object with the last available frame.
-
property
link_sources¶ Returns potential Link or Stream sources.
-
matches(spec)¶ Matches a specification against the current Plot.
-
model_changed(model)¶ Determines if the bokeh model was just changed on the frontend. Useful to suppress boomeranging events, e.g. when the frontend just sent an update to the x_range this should not trigger an update on the backend.
-
push()¶ Pushes plot updates to the frontend.
-
refresh(**kwargs)¶ Refreshes the plot by rerendering it and then pushing the updated data if the plot has an associated Comm.
-
set_root(root)¶ Sets the root model on all subplots.
-
property
state¶ The plotting state that gets updated via the update method and used by the renderer to generate output.
-
sync_sources()¶ Syncs data sources between Elements, which draw data from the same object.
-
traverse(fn=None, specs=None, full_breadth=True)¶ Traverses any nested DimensionedPlot returning a list of all plots that match the specs. The specs should be supplied as a list of either Plot types or callables, which should return a boolean given the plot class.
-
update(key)¶ Update the internal state of the Plot to represent the given key tuple (where integers represent frames). Returns this state.
-
update_frame(key, ranges=None, plot=None, element=None)¶ Updates an existing plot with data corresponding to the key.
-
-
class
holoviews.plotting.bokeh.element.ElementPlot(element, plot=None, **params)[source]¶ Bases:
holoviews.plotting.bokeh.plot.BokehPlot,holoviews.plotting.plot.GenericElementPlotParameters inherited from:
holoviews.plotting.plot.DimensionedPlot: fontscale, show_title, normalize, projectionholoviews.plotting.plot.GenericElementPlot: apply_ranges, apply_extents, bgcolor, default_span, hooks, invert_axes, invert_xaxis, invert_yaxis, finalize_hooks, logx, logy, padding, show_legend, show_grid, xaxis, yaxis, xlabel, ylabel, xlim, ylim, zlim, xrotation, yrotation, xticks, yticksholoviews.plotting.bokeh.plot.BokehPlot: title, title_format, shared_datasourcefontsize= param.Parameter(default={‘title’: ‘12pt’})Specifies various fontsizes of the displayed text. Finer control is available by supplying a dictionary where any unmentioned keys reverts to the default sizes, e.g: {‘ticks’: ‘20pt’, ‘title’: ‘15pt’, ‘ylabel’: ‘5px’, ‘xlabel’: ‘5px’}
toolbar= param.ObjectSelector(default=’right’, objects=[‘above’, ‘below’, ‘left’, ‘right’, ‘disable’, None])The toolbar location, must be one of ‘above’, ‘below’, ‘left’, ‘right’, None.
width= param.Integer(bounds=(0, None), default=300, inclusive_bounds=(True, True))The width of the component (in pixels). This can be either fixed or preferred width, depending on width sizing policy.
height= param.Integer(bounds=(0, None), default=300, inclusive_bounds=(True, True))The height of the component (in pixels). This can be either fixed or preferred height, depending on height sizing policy.
active_tools= param.List(bounds=(0, None), default=[])Allows specifying which tools are active by default. Note that only one tool per gesture type can be active, e.g. both ‘pan’ and ‘box_zoom’ are drag tools, so if both are listed only the last one will be active.
align= param.ObjectSelector(default=’start’, objects=[‘start’, ‘center’, ‘end’])Alignment (vertical or horizontal) of the plot in a layout.
border= param.Number(default=10, inclusive_bounds=(True, True))Minimum border around plot.
aspect= param.Parameter()The aspect ratio mode of the plot. By default, a plot may select its own appropriate aspect ratio but sometimes it may be necessary to force a square aspect ratio (e.g. to display the plot as an element of a grid). The modes ‘auto’ and ‘equal’ correspond to the axis modes of the same name in matplotlib, a numeric value specifying the ratio between plot width and height may also be passed. To control the aspect ratio between the axis scales use the data_aspect option instead.
data_aspect= param.Number(inclusive_bounds=(True, True))Defines the aspect of the axis scaling, i.e. the ratio of y-unit to x-unit.
frame_width= param.Integer(bounds=(0, None), inclusive_bounds=(True, True))The width of the component (in pixels). This can be either fixed or preferred width, depending on width sizing policy.
frame_height= param.Integer(bounds=(0, None), inclusive_bounds=(True, True))The height of the component (in pixels). This can be either fixed or preferred height, depending on height sizing policy.
min_width= param.Integer(bounds=(0, None), inclusive_bounds=(True, True))Minimal width of the component (in pixels) if width is adjustable.
min_height= param.Integer(bounds=(0, None), inclusive_bounds=(True, True))Minimal height of the component (in pixels) if height is adjustable.
max_width= param.Integer(bounds=(0, None), inclusive_bounds=(True, True))Minimal width of the component (in pixels) if width is adjustable.
max_height= param.Integer(bounds=(0, None), inclusive_bounds=(True, True))Minimal height of the component (in pixels) if height is adjustable.
margin= param.Parameter()Allows to create additional space around the component. May be specified as a two-tuple of the form (vertical, horizontal) or a four-tuple (top, right, bottom, left).
responsive= param.ObjectSelector(default=False, objects=[False, True, ‘width’, ‘height’])gridstyle= param.Dict(class_=<class ‘dict’>, default={})Allows customizing the grid style, e.g. grid_line_color defines the line color for both grids while xgrid_line_color exclusively customizes the x-axis grid lines.
labelled= param.List(bounds=(0, None), default=[‘x’, ‘y’])Whether to plot the ‘x’ and ‘y’ labels.
lod= param.Dict(class_=<class ‘dict’>, default={‘factor’: 10, ‘interval’: 300, ‘threshold’: 2000, ‘timeout’: 500})Bokeh plots offer “Level of Detail” (LOD) capability to accommodate large (but not huge) amounts of data. The available options are: * factor : Decimation factor to use when applying decimation. * interval : Interval (in ms) downsampling will be enabled after an interactive event. * threshold : Number of samples before downsampling is enabled. * timeout : Timeout (in ms) for checking whether interactive tool events are still occurring.
show_frame= param.Boolean(bounds=(0, 1), default=True)Whether or not to show a complete frame around the plot.
shared_axes= param.Boolean(bounds=(0, 1), default=True)Whether to invert the share axes across plots for linked panning and zooming.
default_tools= param.List(bounds=(0, None), default=[‘save’, ‘pan’, ‘wheel_zoom’, ‘box_zoom’, ‘reset’])A list of plugin tools to use on the plot.
tools= param.List(bounds=(0, None), default=[])A list of plugin tools to use on the plot.
xformatter= param.ClassSelector(class_=(<class ‘str’>, <class ‘bokeh.models.formatters.TickFormatter’>, <class ‘function’>))Formatter for ticks along the x-axis.
yformatter= param.ClassSelector(class_=(<class ‘str’>, <class ‘bokeh.models.formatters.TickFormatter’>, <class ‘function’>))Formatter for ticks along the x-axis.
-
cleanup()¶ Cleans up references to the plot after the plot has been deleted. Traverses through all plots cleaning up Callbacks and Stream subscribers.
-
compute_ranges(obj, key, ranges)¶ Given an object, a specific key, and the normalization options, this method will find the specified normalization options on the appropriate OptionTree, group the elements according to the selected normalization option (i.e. either per frame or over the whole animation) and finally compute the dimension ranges in each group. The new set of ranges is returned.
-
property
current_handles¶ Should return a list of plot objects that have changed and should be updated.
-
property
framewise¶ Property to determine whether the current frame should have framewise normalization enabled. Required for bokeh plotting classes to determine whether to send updated ranges for each frame.
-
get_data(element, ranges, style)¶ Returns the data from an element in the appropriate format for initializing or updating a ColumnDataSource and a dictionary which maps the expected keywords arguments of a glyph to the column in the datasource.
-
get_extents(element, ranges, range_type='combined', xdim=None, ydim=None, zdim=None)¶ Gets the extents for the axes from the current Element. The globally computed ranges can optionally override the extents.
The extents are computed by combining the data ranges, extents and dimension ranges. Each of these can be obtained individually by setting the range_type to one of:
‘data’: Just the data ranges
‘extents’: Element.extents
‘soft’: Dimension.soft_range values
‘hard’: Dimension.range values
To obtain the combined range, which includes range padding the default may be used:
‘combined’: All the range types combined and padding applied
This allows Overlay plots to obtain each range and combine them appropriately for all the objects in the overlay.
-
get_padding(obj, extents)¶ Computes padding along the axes taking into account the plot aspect.
-
get_zorder(overlay, key, el)¶ Computes the z-order of element in the NdOverlay taking into account possible batching of elements.
-
initialize_plot(ranges=None, plot=None, plots=None, source=None)[source]¶ Initializes a new plot object with the last available frame.
-
property
link_sources¶ Returns potential Link or Stream sources.
-
matches(spec)¶ Matches a specification against the current Plot.
-
model_changed(model)[source]¶ Determines if the bokeh model was just changed on the frontend. Useful to suppress boomeranging events, e.g. when the frontend just sent an update to the x_range this should not trigger an update on the backend.
-
push()¶ Pushes plot updates to the frontend.
-
refresh(**kwargs)¶ Refreshes the plot by rerendering it and then pushing the updated data if the plot has an associated Comm.
-
set_root(root)¶ Sets the root model on all subplots.
-
property
state¶ The plotting state that gets updated via the update method and used by the renderer to generate output.
-
sync_sources()¶ Syncs data sources between Elements, which draw data from the same object.
-
traverse(fn=None, specs=None, full_breadth=True)¶ Traverses any nested DimensionedPlot returning a list of all plots that match the specs. The specs should be supplied as a list of either Plot types or callables, which should return a boolean given the plot class.
-
update(key)¶ Update the internal state of the Plot to represent the given key tuple (where integers represent frames). Returns this state.
-
class
holoviews.plotting.bokeh.element.LegendPlot(element, plot=None, **params)[source]¶ Bases:
holoviews.plotting.bokeh.element.ElementPlotParameters inherited from:
holoviews.plotting.plot.DimensionedPlot: fontscale, show_title, normalize, projectionholoviews.plotting.plot.GenericElementPlot: apply_ranges, apply_extents, bgcolor, default_span, hooks, invert_axes, invert_xaxis, invert_yaxis, finalize_hooks, logx, logy, padding, show_legend, show_grid, xaxis, yaxis, xlabel, ylabel, xlim, ylim, zlim, xrotation, yrotation, xticks, yticksholoviews.plotting.bokeh.plot.BokehPlot: title, title_format, shared_datasourceholoviews.plotting.bokeh.element.ElementPlot: fontsize, toolbar, width, height, active_tools, align, border, aspect, data_aspect, frame_width, frame_height, min_width, min_height, max_width, max_height, margin, responsive, gridstyle, labelled, lod, show_frame, shared_axes, default_tools, tools, xformatter, yformatterlegend_position= param.ObjectSelector(default=’top_right’, objects=[‘top_right’, ‘top_left’, ‘bottom_left’, ‘bottom_right’, ‘right’, ‘left’, ‘top’, ‘bottom’])Allows selecting between a number of predefined legend position options. The predefined options may be customized in the legend_specs class attribute.
legend_muted= param.Boolean(bounds=(0, 1), default=False)Controls whether the legend entries are muted by default.
legend_offset= param.NumericTuple(default=(0, 0), length=2)If legend is placed outside the axis, this determines the (width, height) offset in pixels from the original position.
legend_cols= param.Integer(default=False, inclusive_bounds=(True, True))Whether to lay out the legend as columns.
legend_opts= param.Dict(class_=<class ‘dict’>, default={})Allows setting specific styling options for the colorbar.
-
cleanup()¶ Cleans up references to the plot after the plot has been deleted. Traverses through all plots cleaning up Callbacks and Stream subscribers.
-
compute_ranges(obj, key, ranges)¶ Given an object, a specific key, and the normalization options, this method will find the specified normalization options on the appropriate OptionTree, group the elements according to the selected normalization option (i.e. either per frame or over the whole animation) and finally compute the dimension ranges in each group. The new set of ranges is returned.
-
property
current_handles¶ Should return a list of plot objects that have changed and should be updated.
-
property
framewise¶ Property to determine whether the current frame should have framewise normalization enabled. Required for bokeh plotting classes to determine whether to send updated ranges for each frame.
-
get_aspect(xspan, yspan)¶ Computes the aspect ratio of the plot
-
get_data(element, ranges, style)¶ Returns the data from an element in the appropriate format for initializing or updating a ColumnDataSource and a dictionary which maps the expected keywords arguments of a glyph to the column in the datasource.
-
get_extents(element, ranges, range_type='combined', xdim=None, ydim=None, zdim=None)¶ Gets the extents for the axes from the current Element. The globally computed ranges can optionally override the extents.
The extents are computed by combining the data ranges, extents and dimension ranges. Each of these can be obtained individually by setting the range_type to one of:
‘data’: Just the data ranges
‘extents’: Element.extents
‘soft’: Dimension.soft_range values
‘hard’: Dimension.range values
To obtain the combined range, which includes range padding the default may be used:
‘combined’: All the range types combined and padding applied
This allows Overlay plots to obtain each range and combine them appropriately for all the objects in the overlay.
-
get_padding(obj, extents)¶ Computes padding along the axes taking into account the plot aspect.
-
get_zorder(overlay, key, el)¶ Computes the z-order of element in the NdOverlay taking into account possible batching of elements.
-
initialize_plot(ranges=None, plot=None, plots=None, source=None)¶ Initializes a new plot object with the last available frame.
-
property
link_sources¶ Returns potential Link or Stream sources.
-
matches(spec)¶ Matches a specification against the current Plot.
-
model_changed(model)¶ Determines if the bokeh model was just changed on the frontend. Useful to suppress boomeranging events, e.g. when the frontend just sent an update to the x_range this should not trigger an update on the backend.
-
push()¶ Pushes plot updates to the frontend.
-
refresh(**kwargs)¶ Refreshes the plot by rerendering it and then pushing the updated data if the plot has an associated Comm.
-
set_root(root)¶ Sets the root model on all subplots.
-
property
state¶ The plotting state that gets updated via the update method and used by the renderer to generate output.
-
sync_sources()¶ Syncs data sources between Elements, which draw data from the same object.
-
traverse(fn=None, specs=None, full_breadth=True)¶ Traverses any nested DimensionedPlot returning a list of all plots that match the specs. The specs should be supplied as a list of either Plot types or callables, which should return a boolean given the plot class.
-
update(key)¶ Update the internal state of the Plot to represent the given key tuple (where integers represent frames). Returns this state.
-
update_frame(key, ranges=None, plot=None, element=None)¶ Updates an existing plot with data corresponding to the key.
-
class
holoviews.plotting.bokeh.element.OverlayPlot(overlay, ranges=None, batched=True, keys=None, group_counter=None, **params)[source]¶ Bases:
holoviews.plotting.plot.GenericOverlayPlot,holoviews.plotting.bokeh.element.LegendPlotParameters inherited from:
holoviews.plotting.plot.DimensionedPlot: fontscale, show_title, normalize, projectionholoviews.plotting.plot.GenericElementPlot: apply_ranges, apply_extents, bgcolor, default_span, hooks, invert_axes, invert_xaxis, invert_yaxis, finalize_hooks, logx, logy, padding, show_grid, xaxis, yaxis, xlabel, ylabel, xlim, ylim, zlim, xrotation, yrotation, xticks, yticksholoviews.plotting.bokeh.plot.BokehPlot: title, title_format, shared_datasourceholoviews.plotting.bokeh.element.ElementPlot: fontsize, toolbar, width, height, active_tools, align, border, aspect, data_aspect, frame_width, frame_height, min_width, min_height, max_width, max_height, margin, responsive, gridstyle, labelled, lod, show_frame, shared_axes, default_tools, tools, xformatter, yformatterholoviews.plotting.bokeh.element.LegendPlot: legend_position, legend_muted, legend_offset, legend_cols, legend_optsholoviews.plotting.plot.GenericOverlayPlot: show_legend, batched, legend_limit, style_groupingtabs= param.Boolean(bounds=(0, 1), default=False)Whether to display overlaid plots in separate panes
multiple_legends= param.Boolean(bounds=(0, 1), default=False)Whether to split the legend for subplots into multiple legends.
-
cleanup()¶ Cleans up references to the plot after the plot has been deleted. Traverses through all plots cleaning up Callbacks and Stream subscribers.
-
compute_ranges(obj, key, ranges)¶ Given an object, a specific key, and the normalization options, this method will find the specified normalization options on the appropriate OptionTree, group the elements according to the selected normalization option (i.e. either per frame or over the whole animation) and finally compute the dimension ranges in each group. The new set of ranges is returned.
-
property
current_handles¶ Should return a list of plot objects that have changed and should be updated.
-
property
framewise¶ Property to determine whether the current frame should have framewise normalization enabled. Required for bokeh plotting classes to determine whether to send updated ranges for each frame.
-
get_aspect(xspan, yspan)¶ Computes the aspect ratio of the plot
-
get_data(element, ranges, style)¶ Returns the data from an element in the appropriate format for initializing or updating a ColumnDataSource and a dictionary which maps the expected keywords arguments of a glyph to the column in the datasource.
-
get_extents(overlay, ranges, range_type='combined')¶ Gets the extents for the axes from the current Element. The globally computed ranges can optionally override the extents.
The extents are computed by combining the data ranges, extents and dimension ranges. Each of these can be obtained individually by setting the range_type to one of:
‘data’: Just the data ranges
‘extents’: Element.extents
‘soft’: Dimension.soft_range values
‘hard’: Dimension.range values
To obtain the combined range, which includes range padding the default may be used:
‘combined’: All the range types combined and padding applied
This allows Overlay plots to obtain each range and combine them appropriately for all the objects in the overlay.
-
get_padding(obj, extents)¶ Computes padding along the axes taking into account the plot aspect.
-
get_zorder(overlay, key, el)¶ Computes the z-order of element in the NdOverlay taking into account possible batching of elements.
-
property
link_sources¶ Returns potential Link or Stream sources.
-
matches(spec)¶ Matches a specification against the current Plot.
-
model_changed(model)¶ Determines if the bokeh model was just changed on the frontend. Useful to suppress boomeranging events, e.g. when the frontend just sent an update to the x_range this should not trigger an update on the backend.
-
push()¶ Pushes plot updates to the frontend.
-
refresh(**kwargs)¶ Refreshes the plot by rerendering it and then pushing the updated data if the plot has an associated Comm.
-
set_root(root)¶ Sets the root model on all subplots.
-
property
state¶ The plotting state that gets updated via the update method and used by the renderer to generate output.
-
sync_sources()¶ Syncs data sources between Elements, which draw data from the same object.
-
traverse(fn=None, specs=None, full_breadth=True)¶ Traverses any nested DimensionedPlot returning a list of all plots that match the specs. The specs should be supplied as a list of either Plot types or callables, which should return a boolean given the plot class.
-
update(key)¶ Update the internal state of the Plot to represent the given key tuple (where integers represent frames). Returns this state.
geometry Module

-
class
holoviews.plotting.bokeh.geometry.RectanglesPlot(element, plot=None, **params)[source]¶ Bases:
holoviews.plotting.mixins.GeomMixin,holoviews.plotting.bokeh.element.LegendPlot,holoviews.plotting.bokeh.element.ColorbarPlotParameters inherited from:
holoviews.plotting.plot.DimensionedPlot: fontscale, show_title, normalize, projectionholoviews.plotting.plot.GenericElementPlot: apply_ranges, apply_extents, bgcolor, default_span, hooks, invert_axes, invert_xaxis, invert_yaxis, finalize_hooks, logx, logy, padding, show_legend, show_grid, xaxis, yaxis, xlabel, ylabel, xlim, ylim, zlim, xrotation, yrotation, xticks, yticksholoviews.plotting.bokeh.plot.BokehPlot: title, title_format, shared_datasourceholoviews.plotting.bokeh.element.ElementPlot: fontsize, toolbar, width, height, active_tools, align, border, aspect, data_aspect, frame_width, frame_height, min_width, min_height, max_width, max_height, margin, responsive, gridstyle, labelled, lod, show_frame, shared_axes, default_tools, tools, xformatter, yformatterholoviews.plotting.bokeh.element.ColorbarPlot: color_levels, clabel, clim, cformatter, colorbar, colorbar_position, colorbar_opts, clipping_colors, logz, symmetricholoviews.plotting.bokeh.element.LegendPlot: legend_position, legend_muted, legend_offset, legend_cols, legend_optsselected= param.List(bounds=(0, None))The current selection as a list of integers corresponding to the selected items.
-
cleanup()¶ Cleans up references to the plot after the plot has been deleted. Traverses through all plots cleaning up Callbacks and Stream subscribers.
-
compute_ranges(obj, key, ranges)¶ Given an object, a specific key, and the normalization options, this method will find the specified normalization options on the appropriate OptionTree, group the elements according to the selected normalization option (i.e. either per frame or over the whole animation) and finally compute the dimension ranges in each group. The new set of ranges is returned.
-
property
current_handles¶ Should return a list of plot objects that have changed and should be updated.
-
property
framewise¶ Property to determine whether the current frame should have framewise normalization enabled. Required for bokeh plotting classes to determine whether to send updated ranges for each frame.
-
get_aspect(xspan, yspan)¶ Computes the aspect ratio of the plot
-
get_data(element, ranges, style)[source]¶ Returns the data from an element in the appropriate format for initializing or updating a ColumnDataSource and a dictionary which maps the expected keywords arguments of a glyph to the column in the datasource.
-
get_extents(element, ranges, range_type='combined')¶ Use first two key dimensions to set names, and all four to set the data range.
-
get_padding(obj, extents)¶ Computes padding along the axes taking into account the plot aspect.
-
get_zorder(overlay, key, el)¶ Computes the z-order of element in the NdOverlay taking into account possible batching of elements.
-
initialize_plot(ranges=None, plot=None, plots=None, source=None)¶ Initializes a new plot object with the last available frame.
-
property
link_sources¶ Returns potential Link or Stream sources.
-
matches(spec)¶ Matches a specification against the current Plot.
-
model_changed(model)¶ Determines if the bokeh model was just changed on the frontend. Useful to suppress boomeranging events, e.g. when the frontend just sent an update to the x_range this should not trigger an update on the backend.
-
push()¶ Pushes plot updates to the frontend.
-
refresh(**kwargs)¶ Refreshes the plot by rerendering it and then pushing the updated data if the plot has an associated Comm.
-
set_root(root)¶ Sets the root model on all subplots.
-
property
state¶ The plotting state that gets updated via the update method and used by the renderer to generate output.
-
sync_sources()¶ Syncs data sources between Elements, which draw data from the same object.
-
traverse(fn=None, specs=None, full_breadth=True)¶ Traverses any nested DimensionedPlot returning a list of all plots that match the specs. The specs should be supplied as a list of either Plot types or callables, which should return a boolean given the plot class.
-
update(key)¶ Update the internal state of the Plot to represent the given key tuple (where integers represent frames). Returns this state.
-
update_frame(key, ranges=None, plot=None, element=None)¶ Updates an existing plot with data corresponding to the key.
-
class
holoviews.plotting.bokeh.geometry.SegmentPlot(element, plot=None, **params)[source]¶ Bases:
holoviews.plotting.mixins.GeomMixin,holoviews.plotting.bokeh.element.ColorbarPlotSegments are lines in 2D space where each two each dimensions specify a (x, y) node of the line.
Parameters inherited from:
holoviews.plotting.plot.DimensionedPlot: fontscale, show_title, normalize, projectionholoviews.plotting.plot.GenericElementPlot: apply_ranges, apply_extents, bgcolor, default_span, hooks, invert_axes, invert_xaxis, invert_yaxis, finalize_hooks, logx, logy, padding, show_legend, show_grid, xaxis, yaxis, xlabel, ylabel, xlim, ylim, zlim, xrotation, yrotation, xticks, yticksholoviews.plotting.bokeh.plot.BokehPlot: title, title_format, shared_datasourceholoviews.plotting.bokeh.element.ElementPlot: fontsize, toolbar, width, height, active_tools, align, border, aspect, data_aspect, frame_width, frame_height, min_width, min_height, max_width, max_height, margin, responsive, gridstyle, labelled, lod, show_frame, shared_axes, default_tools, tools, xformatter, yformatterholoviews.plotting.bokeh.element.ColorbarPlot: color_levels, clabel, clim, cformatter, colorbar, colorbar_position, colorbar_opts, clipping_colors, logz, symmetricselected= param.List(bounds=(0, None))The current selection as a list of integers corresponding to the selected items.
-
cleanup()¶ Cleans up references to the plot after the plot has been deleted. Traverses through all plots cleaning up Callbacks and Stream subscribers.
-
compute_ranges(obj, key, ranges)¶ Given an object, a specific key, and the normalization options, this method will find the specified normalization options on the appropriate OptionTree, group the elements according to the selected normalization option (i.e. either per frame or over the whole animation) and finally compute the dimension ranges in each group. The new set of ranges is returned.
-
property
current_handles¶ Should return a list of plot objects that have changed and should be updated.
-
property
framewise¶ Property to determine whether the current frame should have framewise normalization enabled. Required for bokeh plotting classes to determine whether to send updated ranges for each frame.
-
get_aspect(xspan, yspan)¶ Computes the aspect ratio of the plot
-
get_data(element, ranges, style)[source]¶ Returns the data from an element in the appropriate format for initializing or updating a ColumnDataSource and a dictionary which maps the expected keywords arguments of a glyph to the column in the datasource.
-
get_extents(element, ranges, range_type='combined')¶ Use first two key dimensions to set names, and all four to set the data range.
-
get_padding(obj, extents)¶ Computes padding along the axes taking into account the plot aspect.
-
get_zorder(overlay, key, el)¶ Computes the z-order of element in the NdOverlay taking into account possible batching of elements.
-
initialize_plot(ranges=None, plot=None, plots=None, source=None)¶ Initializes a new plot object with the last available frame.
-
property
link_sources¶ Returns potential Link or Stream sources.
-
matches(spec)¶ Matches a specification against the current Plot.
-
model_changed(model)¶ Determines if the bokeh model was just changed on the frontend. Useful to suppress boomeranging events, e.g. when the frontend just sent an update to the x_range this should not trigger an update on the backend.
-
push()¶ Pushes plot updates to the frontend.
-
refresh(**kwargs)¶ Refreshes the plot by rerendering it and then pushing the updated data if the plot has an associated Comm.
-
set_root(root)¶ Sets the root model on all subplots.
-
property
state¶ The plotting state that gets updated via the update method and used by the renderer to generate output.
-
sync_sources()¶ Syncs data sources between Elements, which draw data from the same object.
-
traverse(fn=None, specs=None, full_breadth=True)¶ Traverses any nested DimensionedPlot returning a list of all plots that match the specs. The specs should be supplied as a list of either Plot types or callables, which should return a boolean given the plot class.
-
update(key)¶ Update the internal state of the Plot to represent the given key tuple (where integers represent frames). Returns this state.
-
update_frame(key, ranges=None, plot=None, element=None)¶ Updates an existing plot with data corresponding to the key.
graphs Module

-
class
holoviews.plotting.bokeh.graphs.ChordPlot(element, plot=None, **params)[source]¶ Bases:
holoviews.plotting.mixins.ChordMixin,holoviews.plotting.bokeh.graphs.GraphPlotParameters inherited from:
holoviews.plotting.plot.DimensionedPlot: fontscale, show_title, normalize, projectionholoviews.plotting.plot.GenericElementPlot: apply_ranges, apply_extents, bgcolor, default_span, hooks, invert_axes, invert_xaxis, invert_yaxis, finalize_hooks, logx, logy, padding, show_legend, show_grid, xaxis, yaxis, xlabel, ylabel, xlim, ylim, zlim, xrotation, yrotation, xticks, yticksholoviews.plotting.bokeh.plot.BokehPlot: title, title_format, shared_datasourceholoviews.plotting.bokeh.element.ElementPlot: fontsize, toolbar, width, height, active_tools, align, border, aspect, data_aspect, frame_width, frame_height, min_width, min_height, max_width, max_height, margin, responsive, gridstyle, labelled, lod, shared_axes, default_tools, xformatter, yformatterholoviews.plotting.bokeh.element.LegendPlot: legend_position, legend_muted, legend_offset, legend_cols, legend_optsholoviews.plotting.bokeh.element.ColorbarPlot: color_levels, clabel, clim, cformatter, colorbar, colorbar_position, colorbar_opts, clipping_colors, logz, symmetricholoviews.plotting.bokeh.graphs.GraphPlot: tools, arrowhead_length, directed, selection_policy, inspection_policy, color_index, edge_color_indexshow_frame= param.Boolean(bounds=(0, 1), default=False)Whether or not to show a complete frame around the plot.
labels= param.ClassSelector(class_=(<class ‘str’>, <class ‘holoviews.util.transform.dim’>))The dimension or dimension value transform used to draw labels from.
label_index= param.ClassSelector(class_=(<class ‘str’>, <class ‘int’>))Index of the dimension from which the node labels will be drawn
-
cleanup()¶ Cleans up references to the plot after the plot has been deleted. Traverses through all plots cleaning up Callbacks and Stream subscribers.
-
compute_ranges(obj, key, ranges)¶ Given an object, a specific key, and the normalization options, this method will find the specified normalization options on the appropriate OptionTree, group the elements according to the selected normalization option (i.e. either per frame or over the whole animation) and finally compute the dimension ranges in each group. The new set of ranges is returned.
-
property
current_handles¶ Should return a list of plot objects that have changed and should be updated.
-
property
framewise¶ Property to determine whether the current frame should have framewise normalization enabled. Required for bokeh plotting classes to determine whether to send updated ranges for each frame.
-
get_aspect(xspan, yspan)¶ Computes the aspect ratio of the plot
-
get_data(element, ranges, style)[source]¶ Returns the data from an element in the appropriate format for initializing or updating a ColumnDataSource and a dictionary which maps the expected keywords arguments of a glyph to the column in the datasource.
-
get_extents(element, ranges, range_type='combined')¶ A Chord plot is always drawn on a unit circle.
-
get_padding(obj, extents)¶ Computes padding along the axes taking into account the plot aspect.
-
get_zorder(overlay, key, el)¶ Computes the z-order of element in the NdOverlay taking into account possible batching of elements.
-
initialize_plot(ranges=None, plot=None, plots=None, source=None)¶ Initializes a new plot object with the last available frame.
-
property
link_sources¶ Returns potential Link or Stream sources.
-
matches(spec)¶ Matches a specification against the current Plot.
-
model_changed(model)¶ Determines if the bokeh model was just changed on the frontend. Useful to suppress boomeranging events, e.g. when the frontend just sent an update to the x_range this should not trigger an update on the backend.
-
push()¶ Pushes plot updates to the frontend.
-
refresh(**kwargs)¶ Refreshes the plot by rerendering it and then pushing the updated data if the plot has an associated Comm.
-
set_root(root)¶ Sets the root model on all subplots.
-
property
state¶ The plotting state that gets updated via the update method and used by the renderer to generate output.
-
sync_sources()¶ Syncs data sources between Elements, which draw data from the same object.
-
traverse(fn=None, specs=None, full_breadth=True)¶ Traverses any nested DimensionedPlot returning a list of all plots that match the specs. The specs should be supplied as a list of either Plot types or callables, which should return a boolean given the plot class.
-
update(key)¶ Update the internal state of the Plot to represent the given key tuple (where integers represent frames). Returns this state.
-
update_frame(key, ranges=None, plot=None, element=None)¶ Updates an existing plot with data corresponding to the key.
-
class
holoviews.plotting.bokeh.graphs.GraphPlot(element, plot=None, **params)[source]¶ Bases:
holoviews.plotting.bokeh.element.CompositeElementPlot,holoviews.plotting.bokeh.element.ColorbarPlot,holoviews.plotting.bokeh.element.LegendPlotParameters inherited from:
holoviews.plotting.plot.DimensionedPlot: fontscale, show_title, normalize, projectionholoviews.plotting.plot.GenericElementPlot: apply_ranges, apply_extents, bgcolor, default_span, hooks, invert_axes, invert_xaxis, invert_yaxis, finalize_hooks, logx, logy, padding, show_legend, show_grid, xaxis, yaxis, xlabel, ylabel, xlim, ylim, zlim, xrotation, yrotation, xticks, yticksholoviews.plotting.bokeh.plot.BokehPlot: title, title_format, shared_datasourceholoviews.plotting.bokeh.element.ElementPlot: fontsize, toolbar, width, height, active_tools, align, border, aspect, data_aspect, frame_width, frame_height, min_width, min_height, max_width, max_height, margin, responsive, gridstyle, labelled, lod, show_frame, shared_axes, default_tools, xformatter, yformatterholoviews.plotting.bokeh.element.LegendPlot: legend_position, legend_muted, legend_offset, legend_cols, legend_optsholoviews.plotting.bokeh.element.ColorbarPlot: color_levels, clabel, clim, cformatter, colorbar, colorbar_position, colorbar_opts, clipping_colors, logz, symmetrictools= param.List(bounds=(0, None), default=[‘hover’, ‘tap’])A list of plugin tools to use on the plot.
arrowhead_length= param.Number(default=0.025, inclusive_bounds=(True, True))If directed option is enabled this determines the length of the arrows as fraction of the overall extent of the graph.
directed= param.Boolean(bounds=(0, 1), default=False)Whether to draw arrows on the graph edges to indicate the directionality of each edge.
selection_policy= param.ObjectSelector(default=’nodes’, objects=[‘edges’, ‘nodes’, None])Determines policy for inspection of graph components, i.e. whether to highlight nodes or edges when selecting connected edges and nodes respectively.
inspection_policy= param.ObjectSelector(default=’nodes’, objects=[‘edges’, ‘nodes’, None])Determines policy for inspection of graph components, i.e. whether to highlight nodes or edges when hovering over connected edges and nodes respectively.
color_index= param.ClassSelector(class_=(<class ‘str’>, <class ‘int’>))Deprecated in favor of color style mapping, e.g. node_color=dim(‘color’)
edge_color_index= param.ClassSelector(class_=(<class ‘str’>, <class ‘int’>))Deprecated in favor of color style mapping, e.g. edge_color=dim(‘color’)
-
cleanup()¶ Cleans up references to the plot after the plot has been deleted. Traverses through all plots cleaning up Callbacks and Stream subscribers.
-
compute_ranges(obj, key, ranges)¶ Given an object, a specific key, and the normalization options, this method will find the specified normalization options on the appropriate OptionTree, group the elements according to the selected normalization option (i.e. either per frame or over the whole animation) and finally compute the dimension ranges in each group. The new set of ranges is returned.
-
property
current_handles¶ Should return a list of plot objects that have changed and should be updated.
-
property
framewise¶ Property to determine whether the current frame should have framewise normalization enabled. Required for bokeh plotting classes to determine whether to send updated ranges for each frame.
-
get_aspect(xspan, yspan)¶ Computes the aspect ratio of the plot
-
get_data(element, ranges, style)[source]¶ Returns the data from an element in the appropriate format for initializing or updating a ColumnDataSource and a dictionary which maps the expected keywords arguments of a glyph to the column in the datasource.
-
get_extents(element, ranges, range_type='combined')[source]¶ Gets the extents for the axes from the current Element. The globally computed ranges can optionally override the extents.
The extents are computed by combining the data ranges, extents and dimension ranges. Each of these can be obtained individually by setting the range_type to one of:
‘data’: Just the data ranges
‘extents’: Element.extents
‘soft’: Dimension.soft_range values
‘hard’: Dimension.range values
To obtain the combined range, which includes range padding the default may be used:
‘combined’: All the range types combined and padding applied
This allows Overlay plots to obtain each range and combine them appropriately for all the objects in the overlay.
-
get_padding(obj, extents)¶ Computes padding along the axes taking into account the plot aspect.
-
get_zorder(overlay, key, el)¶ Computes the z-order of element in the NdOverlay taking into account possible batching of elements.
-
initialize_plot(ranges=None, plot=None, plots=None, source=None)¶ Initializes a new plot object with the last available frame.
-
property
link_sources¶ Returns potential Link or Stream sources.
-
matches(spec)¶ Matches a specification against the current Plot.
-
model_changed(model)¶ Determines if the bokeh model was just changed on the frontend. Useful to suppress boomeranging events, e.g. when the frontend just sent an update to the x_range this should not trigger an update on the backend.
-
push()¶ Pushes plot updates to the frontend.
-
refresh(**kwargs)¶ Refreshes the plot by rerendering it and then pushing the updated data if the plot has an associated Comm.
-
set_root(root)¶ Sets the root model on all subplots.
-
property
state¶ The plotting state that gets updated via the update method and used by the renderer to generate output.
-
sync_sources()¶ Syncs data sources between Elements, which draw data from the same object.
-
traverse(fn=None, specs=None, full_breadth=True)¶ Traverses any nested DimensionedPlot returning a list of all plots that match the specs. The specs should be supplied as a list of either Plot types or callables, which should return a boolean given the plot class.
-
update(key)¶ Update the internal state of the Plot to represent the given key tuple (where integers represent frames). Returns this state.
-
update_frame(key, ranges=None, plot=None, element=None)¶ Updates an existing plot with data corresponding to the key.
-
class
holoviews.plotting.bokeh.graphs.NodePlot(element, plot=None, **params)[source]¶ Bases:
holoviews.plotting.bokeh.chart.PointPlotSimple subclass of PointPlot which hides x, y position on hover.
Parameters inherited from:
holoviews.plotting.plot.DimensionedPlot: fontscale, show_title, normalize, projectionholoviews.plotting.plot.GenericElementPlot: apply_ranges, apply_extents, bgcolor, default_span, hooks, invert_axes, invert_xaxis, invert_yaxis, finalize_hooks, logx, logy, padding, show_legend, show_grid, xaxis, yaxis, xlabel, ylabel, xlim, ylim, zlim, xrotation, yrotation, xticks, yticksholoviews.plotting.bokeh.plot.BokehPlot: title, title_format, shared_datasourceholoviews.plotting.bokeh.element.ElementPlot: fontsize, toolbar, width, height, active_tools, align, border, aspect, data_aspect, frame_width, frame_height, min_width, min_height, max_width, max_height, margin, responsive, gridstyle, labelled, lod, show_frame, shared_axes, default_tools, tools, xformatter, yformatterholoviews.plotting.bokeh.element.ColorbarPlot: color_levels, clabel, clim, cformatter, colorbar, colorbar_position, colorbar_opts, clipping_colors, logz, symmetricholoviews.plotting.bokeh.element.LegendPlot: legend_position, legend_muted, legend_offset, legend_cols, legend_optsholoviews.plotting.bokeh.chart.PointPlot: jitter, selected, color_index, size_index, scaling_method, scaling_factor, size_fn-
cleanup()¶ Cleans up references to the plot after the plot has been deleted. Traverses through all plots cleaning up Callbacks and Stream subscribers.
-
compute_ranges(obj, key, ranges)¶ Given an object, a specific key, and the normalization options, this method will find the specified normalization options on the appropriate OptionTree, group the elements according to the selected normalization option (i.e. either per frame or over the whole animation) and finally compute the dimension ranges in each group. The new set of ranges is returned.
-
property
current_handles¶ Should return a list of plot objects that have changed and should be updated.
-
property
framewise¶ Property to determine whether the current frame should have framewise normalization enabled. Required for bokeh plotting classes to determine whether to send updated ranges for each frame.
-
get_aspect(xspan, yspan)¶ Computes the aspect ratio of the plot
-
get_data(element, ranges, style)¶ Returns the data from an element in the appropriate format for initializing or updating a ColumnDataSource and a dictionary which maps the expected keywords arguments of a glyph to the column in the datasource.
-
get_extents(element, ranges, range_type='combined', xdim=None, ydim=None, zdim=None)¶ Gets the extents for the axes from the current Element. The globally computed ranges can optionally override the extents.
The extents are computed by combining the data ranges, extents and dimension ranges. Each of these can be obtained individually by setting the range_type to one of:
‘data’: Just the data ranges
‘extents’: Element.extents
‘soft’: Dimension.soft_range values
‘hard’: Dimension.range values
To obtain the combined range, which includes range padding the default may be used:
‘combined’: All the range types combined and padding applied
This allows Overlay plots to obtain each range and combine them appropriately for all the objects in the overlay.
-
get_padding(obj, extents)¶ Computes padding along the axes taking into account the plot aspect.
-
get_zorder(overlay, key, el)¶ Computes the z-order of element in the NdOverlay taking into account possible batching of elements.
-
initialize_plot(ranges=None, plot=None, plots=None, source=None)¶ Initializes a new plot object with the last available frame.
-
property
link_sources¶ Returns potential Link or Stream sources.
-
matches(spec)¶ Matches a specification against the current Plot.
-
model_changed(model)¶ Determines if the bokeh model was just changed on the frontend. Useful to suppress boomeranging events, e.g. when the frontend just sent an update to the x_range this should not trigger an update on the backend.
-
push()¶ Pushes plot updates to the frontend.
-
refresh(**kwargs)¶ Refreshes the plot by rerendering it and then pushing the updated data if the plot has an associated Comm.
-
set_root(root)¶ Sets the root model on all subplots.
-
size_fn= <ufunc 'absolute'>
-
property
state¶ The plotting state that gets updated via the update method and used by the renderer to generate output.
-
sync_sources()¶ Syncs data sources between Elements, which draw data from the same object.
-
traverse(fn=None, specs=None, full_breadth=True)¶ Traverses any nested DimensionedPlot returning a list of all plots that match the specs. The specs should be supplied as a list of either Plot types or callables, which should return a boolean given the plot class.
-
update(key)¶ Update the internal state of the Plot to represent the given key tuple (where integers represent frames). Returns this state.
-
update_frame(key, ranges=None, plot=None, element=None)¶ Updates an existing plot with data corresponding to the key.
-
-
class
holoviews.plotting.bokeh.graphs.TriMeshPlot(element, plot=None, **params)[source]¶ Bases:
holoviews.plotting.bokeh.graphs.GraphPlotParameters inherited from:
holoviews.plotting.plot.DimensionedPlot: fontscale, show_title, normalize, projectionholoviews.plotting.plot.GenericElementPlot: apply_ranges, apply_extents, bgcolor, default_span, hooks, invert_axes, invert_xaxis, invert_yaxis, finalize_hooks, logx, logy, padding, show_legend, show_grid, xaxis, yaxis, xlabel, ylabel, xlim, ylim, zlim, xrotation, yrotation, xticks, yticksholoviews.plotting.bokeh.plot.BokehPlot: title, title_format, shared_datasourceholoviews.plotting.bokeh.element.ElementPlot: fontsize, toolbar, width, height, active_tools, align, border, aspect, data_aspect, frame_width, frame_height, min_width, min_height, max_width, max_height, margin, responsive, gridstyle, labelled, lod, show_frame, shared_axes, default_tools, xformatter, yformatterholoviews.plotting.bokeh.element.LegendPlot: legend_position, legend_muted, legend_offset, legend_cols, legend_optsholoviews.plotting.bokeh.element.ColorbarPlot: color_levels, clabel, clim, cformatter, colorbar, colorbar_position, colorbar_opts, clipping_colors, logz, symmetricholoviews.plotting.bokeh.graphs.GraphPlot: tools, arrowhead_length, directed, selection_policy, inspection_policy, color_index, edge_color_indexfilled= param.Boolean(bounds=(0, 1), default=False)Whether the triangles should be drawn as filled.
-
cleanup()¶ Cleans up references to the plot after the plot has been deleted. Traverses through all plots cleaning up Callbacks and Stream subscribers.
-
compute_ranges(obj, key, ranges)¶ Given an object, a specific key, and the normalization options, this method will find the specified normalization options on the appropriate OptionTree, group the elements according to the selected normalization option (i.e. either per frame or over the whole animation) and finally compute the dimension ranges in each group. The new set of ranges is returned.
-
property
current_handles¶ Should return a list of plot objects that have changed and should be updated.
-
property
framewise¶ Property to determine whether the current frame should have framewise normalization enabled. Required for bokeh plotting classes to determine whether to send updated ranges for each frame.
-
get_aspect(xspan, yspan)¶ Computes the aspect ratio of the plot
-
get_data(element, ranges, style)¶ Returns the data from an element in the appropriate format for initializing or updating a ColumnDataSource and a dictionary which maps the expected keywords arguments of a glyph to the column in the datasource.
-
get_extents(element, ranges, range_type='combined')¶ Gets the extents for the axes from the current Element. The globally computed ranges can optionally override the extents.
The extents are computed by combining the data ranges, extents and dimension ranges. Each of these can be obtained individually by setting the range_type to one of:
‘data’: Just the data ranges
‘extents’: Element.extents
‘soft’: Dimension.soft_range values
‘hard’: Dimension.range values
To obtain the combined range, which includes range padding the default may be used:
‘combined’: All the range types combined and padding applied
This allows Overlay plots to obtain each range and combine them appropriately for all the objects in the overlay.
-
get_padding(obj, extents)¶ Computes padding along the axes taking into account the plot aspect.
-
get_zorder(overlay, key, el)¶ Computes the z-order of element in the NdOverlay taking into account possible batching of elements.
-
initialize_plot(ranges=None, plot=None, plots=None, source=None)¶ Initializes a new plot object with the last available frame.
-
property
link_sources¶ Returns potential Link or Stream sources.
-
matches(spec)¶ Matches a specification against the current Plot.
-
model_changed(model)¶ Determines if the bokeh model was just changed on the frontend. Useful to suppress boomeranging events, e.g. when the frontend just sent an update to the x_range this should not trigger an update on the backend.
-
push()¶ Pushes plot updates to the frontend.
-
refresh(**kwargs)¶ Refreshes the plot by rerendering it and then pushing the updated data if the plot has an associated Comm.
-
set_root(root)¶ Sets the root model on all subplots.
-
property
state¶ The plotting state that gets updated via the update method and used by the renderer to generate output.
-
sync_sources()¶ Syncs data sources between Elements, which draw data from the same object.
-
traverse(fn=None, specs=None, full_breadth=True)¶ Traverses any nested DimensionedPlot returning a list of all plots that match the specs. The specs should be supplied as a list of either Plot types or callables, which should return a boolean given the plot class.
-
update(key)¶ Update the internal state of the Plot to represent the given key tuple (where integers represent frames). Returns this state.
-
update_frame(key, ranges=None, plot=None, element=None)¶ Updates an existing plot with data corresponding to the key.
heatmap Module

-
class
holoviews.plotting.bokeh.heatmap.HeatMapPlot(element, plot=None, **params)[source]¶ Bases:
holoviews.plotting.bokeh.element.ColorbarPlotParameters inherited from:
holoviews.plotting.plot.DimensionedPlot: fontscale, show_title, normalize, projectionholoviews.plotting.plot.GenericElementPlot: apply_ranges, apply_extents, bgcolor, default_span, hooks, invert_axes, invert_xaxis, invert_yaxis, finalize_hooks, logx, logy, show_grid, xaxis, yaxis, xlabel, ylabel, xlim, ylim, zlim, xrotation, yrotation, xticks, yticksholoviews.plotting.bokeh.plot.BokehPlot: title, title_format, shared_datasourceholoviews.plotting.bokeh.element.ElementPlot: fontsize, toolbar, width, height, active_tools, align, border, aspect, data_aspect, frame_width, frame_height, min_width, min_height, max_width, max_height, margin, responsive, gridstyle, labelled, lod, show_frame, shared_axes, default_tools, tools, xformatter, yformatterholoviews.plotting.bokeh.element.ColorbarPlot: color_levels, clabel, clim, cformatter, colorbar, colorbar_position, colorbar_opts, logz, symmetricpadding= param.ClassSelector(class_=(<class ‘int’>, <class ‘float’>, <class ‘tuple’>), default=0)Fraction by which to increase auto-ranged extents to make datapoints more visible around borders. To compute padding, the axis whose screen size is largest is chosen, and the range of that axis is increased by the specified fraction along each axis. Other axes are then padded ensuring that the amount of screen space devoted to padding is equal for all axes. If specified as a tuple, the int or float values in the tuple will be used for padding in each axis, in order (x,y or x,y,z). For example, for padding=0.2 on a 800x800-pixel plot, an x-axis with the range [0,10] will be padded by 20% to be [-1,11], while a y-axis with a range [0,1000] will be padded to be [-100,1100], which should make the padding be approximately the same number of pixels. But if the same plot is changed to have a height of only 200, the y-range will then be [-400,1400] so that the y-axis padding will still match that of the x-axis. It is also possible to declare non-equal padding value for the lower and upper bound of an axis by supplying nested tuples, e.g. padding=(0.1, (0, 0.1)) will pad the x-axis lower and upper bound as well as the y-axis upper bound by a fraction of 0.1 while the y-axis lower bound is not padded at all.
show_legend= param.Boolean(bounds=(0, 1), default=False)Whether to show legend for the plot.
clipping_colors= param.Dict(class_=<class ‘dict’>, default={‘NaN’: ‘white’})Dictionary to specify colors for clipped values. Allows setting color for NaN values and for values above and below the min and max value. The min, max, or NaN color may specify an RGB(A) color as a either (1) a color hex string of the form #FFFFFF or #FFFFFFFF, (2) a length-3 or length-4 tuple specifying values in the range 0-1, or (3) a named HTML color.
radial= param.Boolean(bounds=(0, 1), default=False)Whether the HeatMap should be radial
xmarks= param.Parameter()Add separation lines to the heatmap for better readability. By default, does not show any separation lines. If parameter is of type integer, draws the given amount of separations lines spread across heatmap. If parameter is of type list containing integers, show separation lines at given indices. If parameter is of type tuple, draw separation lines at given categorical values. If parameter is of type function, draw separation lines where function returns True for passed heatmap category.
ymarks= param.Parameter()Add separation lines to the heatmap for better readability. By default, does not show any separation lines. If parameter is of type integer, draws the given amount of separations lines spread across heatmap. If parameter is of type list containing integers, show separation lines at given indices. If parameter is of type tuple, draw separation lines at given categorical values. If parameter is of type function, draw separation lines where function returns True for passed heatmap category.
-
cleanup()¶ Cleans up references to the plot after the plot has been deleted. Traverses through all plots cleaning up Callbacks and Stream subscribers.
-
compute_ranges(obj, key, ranges)¶ Given an object, a specific key, and the normalization options, this method will find the specified normalization options on the appropriate OptionTree, group the elements according to the selected normalization option (i.e. either per frame or over the whole animation) and finally compute the dimension ranges in each group. The new set of ranges is returned.
-
property
current_handles¶ Should return a list of plot objects that have changed and should be updated.
-
property
framewise¶ Property to determine whether the current frame should have framewise normalization enabled. Required for bokeh plotting classes to determine whether to send updated ranges for each frame.
-
get_aspect(xspan, yspan)¶ Computes the aspect ratio of the plot
-
get_data(element, ranges, style)[source]¶ Returns the data from an element in the appropriate format for initializing or updating a ColumnDataSource and a dictionary which maps the expected keywords arguments of a glyph to the column in the datasource.
-
get_extents(element, ranges, range_type='combined', xdim=None, ydim=None, zdim=None)¶ Gets the extents for the axes from the current Element. The globally computed ranges can optionally override the extents.
The extents are computed by combining the data ranges, extents and dimension ranges. Each of these can be obtained individually by setting the range_type to one of:
‘data’: Just the data ranges
‘extents’: Element.extents
‘soft’: Dimension.soft_range values
‘hard’: Dimension.range values
To obtain the combined range, which includes range padding the default may be used:
‘combined’: All the range types combined and padding applied
This allows Overlay plots to obtain each range and combine them appropriately for all the objects in the overlay.
-
get_padding(obj, extents)¶ Computes padding along the axes taking into account the plot aspect.
-
get_zorder(overlay, key, el)¶ Computes the z-order of element in the NdOverlay taking into account possible batching of elements.
-
initialize_plot(ranges=None, plot=None, plots=None, source=None)¶ Initializes a new plot object with the last available frame.
-
property
link_sources¶ Returns potential Link or Stream sources.
-
matches(spec)¶ Matches a specification against the current Plot.
-
model_changed(model)¶ Determines if the bokeh model was just changed on the frontend. Useful to suppress boomeranging events, e.g. when the frontend just sent an update to the x_range this should not trigger an update on the backend.
-
push()¶ Pushes plot updates to the frontend.
-
refresh(**kwargs)¶ Refreshes the plot by rerendering it and then pushing the updated data if the plot has an associated Comm.
-
set_root(root)¶ Sets the root model on all subplots.
-
property
state¶ The plotting state that gets updated via the update method and used by the renderer to generate output.
-
sync_sources()¶ Syncs data sources between Elements, which draw data from the same object.
-
traverse(fn=None, specs=None, full_breadth=True)¶ Traverses any nested DimensionedPlot returning a list of all plots that match the specs. The specs should be supplied as a list of either Plot types or callables, which should return a boolean given the plot class.
-
update(key)¶ Update the internal state of the Plot to represent the given key tuple (where integers represent frames). Returns this state.
-
update_frame(key, ranges=None, plot=None, element=None)¶ Updates an existing plot with data corresponding to the key.
-
class
holoviews.plotting.bokeh.heatmap.RadialHeatMapPlot(*args, **kwargs)[source]¶ Bases:
holoviews.plotting.bokeh.element.CompositeElementPlot,holoviews.plotting.bokeh.element.ColorbarPlotParameters inherited from:
holoviews.plotting.plot.DimensionedPlot: fontscale, show_title, normalize, projectionholoviews.plotting.plot.GenericElementPlot: apply_ranges, apply_extents, bgcolor, default_span, hooks, invert_axes, invert_xaxis, invert_yaxis, finalize_hooks, logx, logy, padding, show_legend, show_grid, xaxis, yaxis, xlabel, ylabel, xlim, ylim, zlim, xrotationholoviews.plotting.bokeh.plot.BokehPlot: title, title_format, shared_datasourceholoviews.plotting.bokeh.element.ElementPlot: fontsize, toolbar, width, height, active_tools, align, border, aspect, data_aspect, frame_width, frame_height, min_width, min_height, max_width, max_height, margin, responsive, gridstyle, labelled, lod, shared_axes, default_tools, tools, xformatter, yformatterholoviews.plotting.bokeh.element.ColorbarPlot: color_levels, clabel, clim, cformatter, colorbar, colorbar_position, colorbar_opts, logz, symmetricyrotation= param.Number(bounds=(0, 360), default=90, inclusive_bounds=(True, True))Define angle along which yticks/annulars are shown. By default, yticks are drawn like a regular y-axis.
xticks= param.Parameter(default=4)Ticks along x-axis/segments specified as an integer, explicit list of ticks or function. If None, no ticks are shown.
yticks= param.Parameter(default=4)Ticks along y-axis/annulars specified as an integer, explicit list of ticks or function. If None, no ticks are shown.
show_frame= param.Boolean(bounds=(0, 1), default=False)Whether or not to show a complete frame around the plot.
clipping_colors= param.Dict(class_=<class ‘dict’>, default={‘NaN’: ‘white’})Dictionary to specify colors for clipped values. Allows setting color for NaN values and for values above and below the min and max value. The min, max, or NaN color may specify an RGB(A) color as a either (1) a color hex string of the form #FFFFFF or #FFFFFFFF, (2) a length-3 or length-4 tuple specifying values in the range 0-1, or (3) a named HTML color.
start_angle= param.Number(default=1.5707963267948966, inclusive_bounds=(True, True))Define starting angle of the first annulus segment. By default, begins at 12 o’clock.
radius_inner= param.Number(bounds=(0, 0.5), default=0.1, inclusive_bounds=(True, True))Define the radius fraction of inner, empty space.
radius_outer= param.Number(bounds=(0, 1), default=0.05, inclusive_bounds=(True, True))Define the radius fraction of outer space including the labels.
xmarks= param.Parameter()Add separation lines between segments for better readability. By default, does not show any separation lines. If parameter is of type integer, draws the given amount of separations lines spread across radial heatmap. If parameter is of type list containing integers, show separation lines at given indices. If parameter is of type tuple, draw separation lines at given segment values. If parameter is of type function, draw separation lines where function returns True for passed segment value.
ymarks= param.Parameter()Add separation lines between annulars for better readability. By default, does not show any separation lines. If parameter is of type integer, draws the given amount of separations lines spread across radial heatmap. If parameter is of type list containing integers, show separation lines at given indices. If parameter is of type tuple, draw separation lines at given annular values. If parameter is of type function, draw separation lines where function returns True for passed annular value.
max_radius= param.Number(default=0.5, inclusive_bounds=(True, True))Define the maximum radius which is used for the x and y range extents.
radial= param.Boolean(bounds=(0, 1), default=True)Whether the HeatMap should be radial
-
cleanup()¶ Cleans up references to the plot after the plot has been deleted. Traverses through all plots cleaning up Callbacks and Stream subscribers.
-
compute_ranges(obj, key, ranges)¶ Given an object, a specific key, and the normalization options, this method will find the specified normalization options on the appropriate OptionTree, group the elements according to the selected normalization option (i.e. either per frame or over the whole animation) and finally compute the dimension ranges in each group. The new set of ranges is returned.
-
property
current_handles¶ Should return a list of plot objects that have changed and should be updated.
-
property
framewise¶ Property to determine whether the current frame should have framewise normalization enabled. Required for bokeh plotting classes to determine whether to send updated ranges for each frame.
-
get_aspect(xspan, yspan)¶ Computes the aspect ratio of the plot
-
get_data(element, ranges, style)[source]¶ Returns the data from an element in the appropriate format for initializing or updating a ColumnDataSource and a dictionary which maps the expected keywords arguments of a glyph to the column in the datasource.
-
get_default_mapping(z, cmapper)[source]¶ Create dictionary containing default ColumnDataSource glyph to data mappings.
-
get_extents(view, ranges, range_type='combined')[source]¶ Supply custom, static extents because radial heatmaps always have the same boundaries.
-
get_padding(obj, extents)¶ Computes padding along the axes taking into account the plot aspect.
-
get_zorder(overlay, key, el)¶ Computes the z-order of element in the NdOverlay taking into account possible batching of elements.
-
initialize_plot(ranges=None, plot=None, plots=None, source=None)¶ Initializes a new plot object with the last available frame.
-
property
link_sources¶ Returns potential Link or Stream sources.
-
matches(spec)¶ Matches a specification against the current Plot.
-
model_changed(model)¶ Determines if the bokeh model was just changed on the frontend. Useful to suppress boomeranging events, e.g. when the frontend just sent an update to the x_range this should not trigger an update on the backend.
-
push()¶ Pushes plot updates to the frontend.
-
refresh(**kwargs)¶ Refreshes the plot by rerendering it and then pushing the updated data if the plot has an associated Comm.
-
set_root(root)¶ Sets the root model on all subplots.
-
property
state¶ The plotting state that gets updated via the update method and used by the renderer to generate output.
-
sync_sources()¶ Syncs data sources between Elements, which draw data from the same object.
-
traverse(fn=None, specs=None, full_breadth=True)¶ Traverses any nested DimensionedPlot returning a list of all plots that match the specs. The specs should be supplied as a list of either Plot types or callables, which should return a boolean given the plot class.
-
update(key)¶ Update the internal state of the Plot to represent the given key tuple (where integers represent frames). Returns this state.
-
update_frame(key, ranges=None, plot=None, element=None)¶ Updates an existing plot with data corresponding to the key.
hex_tiles Module

-
class
holoviews.plotting.bokeh.hex_tiles.HexTilesPlot(element, plot=None, **params)[source]¶ Bases:
holoviews.plotting.bokeh.element.ColorbarPlotParameters inherited from:
holoviews.plotting.plot.DimensionedPlot: fontscale, show_title, normalize, projectionholoviews.plotting.plot.GenericElementPlot: apply_ranges, apply_extents, bgcolor, default_span, hooks, invert_axes, invert_xaxis, invert_yaxis, finalize_hooks, logx, logy, padding, show_legend, show_grid, xaxis, yaxis, xlabel, ylabel, xlim, ylim, zlim, xrotation, yrotation, xticks, yticksholoviews.plotting.bokeh.plot.BokehPlot: title, title_format, shared_datasourceholoviews.plotting.bokeh.element.ElementPlot: fontsize, toolbar, width, height, active_tools, align, border, aspect, data_aspect, frame_width, frame_height, min_width, min_height, max_width, max_height, margin, responsive, gridstyle, labelled, lod, show_frame, shared_axes, default_tools, tools, xformatter, yformatterholoviews.plotting.bokeh.element.ColorbarPlot: color_levels, clabel, clim, cformatter, colorbar, colorbar_position, colorbar_opts, clipping_colors, logz, symmetricaggregator= param.ClassSelector(class_=(<class ‘function’>, <class ‘tuple’>))Aggregation function or dimension transform used to compute bin values. Defaults to np.size to count the number of values in each bin.
gridsize= param.ClassSelector(class_=(<class ‘int’>, <class ‘tuple’>), default=50)Number of hexagonal bins along x- and y-axes. Defaults to uniform sampling along both axes when setting and integer but independent bin sampling can be specified a tuple of integers corresponding to the number of bins along each axis.
min_count= param.Number(inclusive_bounds=(True, True))The display threshold before a bin is shown, by default bins with a count of less than 1 are hidden.
orientation= param.ObjectSelector(default=’pointy’, objects=[‘flat’, ‘pointy’])The orientation of hexagon bins. By default the pointy side is on top.
color_index= param.ClassSelector(class_=(<class ‘str’>, <class ‘int’>), default=2)Deprecated in favor of color style mapping, e.g. color=dim(‘color’)
max_scale= param.Number(bounds=(0, None), default=0.9, inclusive_bounds=(True, True))When size_index is enabled this defines the maximum size of each bin relative to uniform tile size, i.e. for a value of 1, the largest bin will match the size of bins when scaling is disabled. Setting value larger than 1 will result in overlapping bins.
min_scale= param.Number(bounds=(0, None), default=0, inclusive_bounds=(True, True))When size_index is enabled this defines the minimum size of each bin relative to uniform tile size, i.e. for a value of 1, the smallest bin will match the size of bins when scaling is disabled. Setting value larger than 1 will result in overlapping bins.
size_index= param.ClassSelector(class_=(<class ‘str’>, <class ‘int’>))Index of the dimension from which the sizes will the drawn.
-
aggregator(axis=None)¶ Return the number of elements along a given axis.
- aarray_like
Input data.
- axisint, optional
Axis along which the elements are counted. By default, give the total number of elements.
- element_countint
Number of elements along the specified axis.
shape : dimensions of array ndarray.shape : dimensions of array ndarray.size : number of elements in array
>>> a = np.array([[1,2,3],[4,5,6]])
>>> np.size(a)
6
>>> np.size(a,1)
3
>>> np.size(a,0)
2
-
cleanup()¶ Cleans up references to the plot after the plot has been deleted. Traverses through all plots cleaning up Callbacks and Stream subscribers.
-
compute_ranges(obj, key, ranges)¶ Given an object, a specific key, and the normalization options, this method will find the specified normalization options on the appropriate OptionTree, group the elements according to the selected normalization option (i.e. either per frame or over the whole animation) and finally compute the dimension ranges in each group. The new set of ranges is returned.
-
property
current_handles¶ Should return a list of plot objects that have changed and should be updated.
-
property
framewise¶ Property to determine whether the current frame should have framewise normalization enabled. Required for bokeh plotting classes to determine whether to send updated ranges for each frame.
-
get_aspect(xspan, yspan)¶ Computes the aspect ratio of the plot
-
get_data(element, ranges, style)[source]¶ Returns the data from an element in the appropriate format for initializing or updating a ColumnDataSource and a dictionary which maps the expected keywords arguments of a glyph to the column in the datasource.
-
get_extents(element, ranges, range_type='combined')[source]¶ Gets the extents for the axes from the current Element. The globally computed ranges can optionally override the extents.
The extents are computed by combining the data ranges, extents and dimension ranges. Each of these can be obtained individually by setting the range_type to one of:
‘data’: Just the data ranges
‘extents’: Element.extents
‘soft’: Dimension.soft_range values
‘hard’: Dimension.range values
To obtain the combined range, which includes range padding the default may be used:
‘combined’: All the range types combined and padding applied
This allows Overlay plots to obtain each range and combine them appropriately for all the objects in the overlay.
-
get_padding(obj, extents)¶ Computes padding along the axes taking into account the plot aspect.
-
get_zorder(overlay, key, el)¶ Computes the z-order of element in the NdOverlay taking into account possible batching of elements.
-
initialize_plot(ranges=None, plot=None, plots=None, source=None)¶ Initializes a new plot object with the last available frame.
-
property
link_sources¶ Returns potential Link or Stream sources.
-
matches(spec)¶ Matches a specification against the current Plot.
-
model_changed(model)¶ Determines if the bokeh model was just changed on the frontend. Useful to suppress boomeranging events, e.g. when the frontend just sent an update to the x_range this should not trigger an update on the backend.
-
push()¶ Pushes plot updates to the frontend.
-
refresh(**kwargs)¶ Refreshes the plot by rerendering it and then pushing the updated data if the plot has an associated Comm.
-
set_root(root)¶ Sets the root model on all subplots.
-
property
state¶ The plotting state that gets updated via the update method and used by the renderer to generate output.
-
sync_sources()¶ Syncs data sources between Elements, which draw data from the same object.
-
traverse(fn=None, specs=None, full_breadth=True)¶ Traverses any nested DimensionedPlot returning a list of all plots that match the specs. The specs should be supplied as a list of either Plot types or callables, which should return a boolean given the plot class.
-
update(key)¶ Update the internal state of the Plot to represent the given key tuple (where integers represent frames). Returns this state.
-
update_frame(key, ranges=None, plot=None, element=None)¶ Updates an existing plot with data corresponding to the key.
-
class
holoviews.plotting.bokeh.hex_tiles.hex_binning(*args, **params)[source]¶ Bases:
holoviews.core.operation.OperationApplies hex binning by computing aggregates on a hexagonal grid.
Should not be user facing as the returned element is not directly useable.
Parameters inherited from:
holoviews.core.operation.Operation: group, dynamic, input_ranges, link_inputs, streamsaggregator= param.ClassSelector(class_=(<class ‘function’>, <class ‘tuple’>))Aggregation function or dimension transform used to compute bin values. Defaults to np.size to count the number of values in each bin.
gridsize= param.ClassSelector(class_=(<class ‘int’>, <class ‘tuple’>), default=50)invert_axes= param.Boolean(bounds=(0, 1), default=False)min_count= param.Number(inclusive_bounds=(True, True))orientation= param.ObjectSelector(default=’pointy’, objects=[‘flat’, ‘pointy’])-
aggregator(axis=None)¶ Return the number of elements along a given axis.
- aarray_like
Input data.
- axisint, optional
Axis along which the elements are counted. By default, give the total number of elements.
- element_countint
Number of elements along the specified axis.
shape : dimensions of array ndarray.shape : dimensions of array ndarray.size : number of elements in array
>>> a = np.array([[1,2,3],[4,5,6]])
>>> np.size(a)
6
>>> np.size(a,1)
3
>>> np.size(a,0)
2
-
classmethod
get_overlay_bounds(overlay)¶ Returns the extents if all the elements of an overlay agree on a consistent extents, otherwise raises an exception.
-
classmethod
get_overlay_label(overlay, default_label='')¶ Returns a label if all the elements of an overlay agree on a consistent label, otherwise returns the default label.
-
instance(**params)¶ Return an instance of this class, copying parameters from any existing instance provided.
-
pprint(imports=None, prefix='\n ', unknown_value='<?>', qualify=False, separator='')¶ Same as Parameterized.pprint, except that X.classname(Y is replaced with X.classname.instance(Y
-
process_element(element, key, **params)¶ The process_element method allows a single element to be operated on given an externally supplied key.
-
script_repr(imports=[], prefix=' ')¶ Same as Parameterized.script_repr, except that X.classname(Y is replaced with X.classname.instance(Y
-
classmethod
search(element, pattern)¶ Helper method that returns a list of elements that match the given path pattern of form {type}.{group}.{label}.
The input may be a Layout, an Overlay type or a single Element.
path Module

-
class
holoviews.plotting.bokeh.path.ContourPlot(*args, **params)[source]¶ Bases:
holoviews.plotting.bokeh.path.PathPlotParameters inherited from:
holoviews.plotting.plot.DimensionedPlot: fontscale, show_title, normalize, projectionholoviews.plotting.plot.GenericElementPlot: apply_ranges, apply_extents, bgcolor, default_span, hooks, invert_axes, invert_xaxis, invert_yaxis, finalize_hooks, logx, logy, padding, show_grid, xaxis, yaxis, xlabel, ylabel, xlim, ylim, zlim, xrotation, yrotation, xticks, yticksholoviews.plotting.bokeh.plot.BokehPlot: title, title_format, shared_datasourceholoviews.plotting.bokeh.element.ElementPlot: fontsize, toolbar, width, height, active_tools, align, border, aspect, data_aspect, frame_width, frame_height, min_width, min_height, max_width, max_height, margin, responsive, gridstyle, labelled, lod, show_frame, shared_axes, default_tools, tools, xformatter, yformatterholoviews.plotting.bokeh.element.ColorbarPlot: color_levels, clabel, clim, cformatter, colorbar, colorbar_position, colorbar_opts, clipping_colors, logz, symmetricholoviews.plotting.bokeh.element.LegendPlot: legend_position, legend_muted, legend_offset, legend_cols, legend_optsshow_legend= param.Boolean(bounds=(0, 1), default=False)Whether to show legend for the plot.
selected= param.List(bounds=(0, None))The current selection as a list of integers corresponding to the selected items.
color_index= param.ClassSelector(class_=(<class ‘str’>, <class ‘int’>), default=0)Deprecated in favor of color style mapping, e.g. color=dim(‘color’)
-
cleanup()¶ Cleans up references to the plot after the plot has been deleted. Traverses through all plots cleaning up Callbacks and Stream subscribers.
-
compute_ranges(obj, key, ranges)¶ Given an object, a specific key, and the normalization options, this method will find the specified normalization options on the appropriate OptionTree, group the elements according to the selected normalization option (i.e. either per frame or over the whole animation) and finally compute the dimension ranges in each group. The new set of ranges is returned.
-
property
current_handles¶ Should return a list of plot objects that have changed and should be updated.
-
property
framewise¶ Property to determine whether the current frame should have framewise normalization enabled. Required for bokeh plotting classes to determine whether to send updated ranges for each frame.
-
get_aspect(xspan, yspan)¶ Computes the aspect ratio of the plot
-
get_data(element, ranges, style)[source]¶ Returns the data from an element in the appropriate format for initializing or updating a ColumnDataSource and a dictionary which maps the expected keywords arguments of a glyph to the column in the datasource.
-
get_extents(element, ranges, range_type='combined', xdim=None, ydim=None, zdim=None)¶ Gets the extents for the axes from the current Element. The globally computed ranges can optionally override the extents.
The extents are computed by combining the data ranges, extents and dimension ranges. Each of these can be obtained individually by setting the range_type to one of:
‘data’: Just the data ranges
‘extents’: Element.extents
‘soft’: Dimension.soft_range values
‘hard’: Dimension.range values
To obtain the combined range, which includes range padding the default may be used:
‘combined’: All the range types combined and padding applied
This allows Overlay plots to obtain each range and combine them appropriately for all the objects in the overlay.
-
get_padding(obj, extents)¶ Computes padding along the axes taking into account the plot aspect.
-
get_zorder(overlay, key, el)¶ Computes the z-order of element in the NdOverlay taking into account possible batching of elements.
-
initialize_plot(ranges=None, plot=None, plots=None, source=None)¶ Initializes a new plot object with the last available frame.
-
property
link_sources¶ Returns potential Link or Stream sources.
-
matches(spec)¶ Matches a specification against the current Plot.
-
model_changed(model)¶ Determines if the bokeh model was just changed on the frontend. Useful to suppress boomeranging events, e.g. when the frontend just sent an update to the x_range this should not trigger an update on the backend.
-
push()¶ Pushes plot updates to the frontend.
-
refresh(**kwargs)¶ Refreshes the plot by rerendering it and then pushing the updated data if the plot has an associated Comm.
-
set_root(root)¶ Sets the root model on all subplots.
-
property
state¶ The plotting state that gets updated via the update method and used by the renderer to generate output.
-
sync_sources()¶ Syncs data sources between Elements, which draw data from the same object.
-
traverse(fn=None, specs=None, full_breadth=True)¶ Traverses any nested DimensionedPlot returning a list of all plots that match the specs. The specs should be supplied as a list of either Plot types or callables, which should return a boolean given the plot class.
-
update(key)¶ Update the internal state of the Plot to represent the given key tuple (where integers represent frames). Returns this state.
-
update_frame(key, ranges=None, plot=None, element=None)¶ Updates an existing plot with data corresponding to the key.
-
class
holoviews.plotting.bokeh.path.PathPlot(element, plot=None, **params)[source]¶ Bases:
holoviews.plotting.bokeh.element.LegendPlot,holoviews.plotting.bokeh.element.ColorbarPlotParameters inherited from:
holoviews.plotting.plot.DimensionedPlot: fontscale, show_title, normalize, projectionholoviews.plotting.plot.GenericElementPlot: apply_ranges, apply_extents, bgcolor, default_span, hooks, invert_axes, invert_xaxis, invert_yaxis, finalize_hooks, logx, logy, padding, show_grid, xaxis, yaxis, xlabel, ylabel, xlim, ylim, zlim, xrotation, yrotation, xticks, yticksholoviews.plotting.bokeh.plot.BokehPlot: title, title_format, shared_datasourceholoviews.plotting.bokeh.element.ElementPlot: fontsize, toolbar, width, height, active_tools, align, border, aspect, data_aspect, frame_width, frame_height, min_width, min_height, max_width, max_height, margin, responsive, gridstyle, labelled, lod, show_frame, shared_axes, default_tools, tools, xformatter, yformatterholoviews.plotting.bokeh.element.ColorbarPlot: color_levels, clabel, clim, cformatter, colorbar, colorbar_position, colorbar_opts, clipping_colors, logz, symmetricholoviews.plotting.bokeh.element.LegendPlot: legend_position, legend_muted, legend_offset, legend_cols, legend_optsshow_legend= param.Boolean(bounds=(0, 1), default=False)Whether to show legend for the plot.
selected= param.List(bounds=(0, None))The current selection as a list of integers corresponding to the selected items.
color_index= param.ClassSelector(class_=(<class ‘str’>, <class ‘int’>))Deprecated in favor of color style mapping, e.g. color=dim(‘color’)
-
cleanup()¶ Cleans up references to the plot after the plot has been deleted. Traverses through all plots cleaning up Callbacks and Stream subscribers.
-
compute_ranges(obj, key, ranges)¶ Given an object, a specific key, and the normalization options, this method will find the specified normalization options on the appropriate OptionTree, group the elements according to the selected normalization option (i.e. either per frame or over the whole animation) and finally compute the dimension ranges in each group. The new set of ranges is returned.
-
property
current_handles¶ Should return a list of plot objects that have changed and should be updated.
-
property
framewise¶ Property to determine whether the current frame should have framewise normalization enabled. Required for bokeh plotting classes to determine whether to send updated ranges for each frame.
-
get_aspect(xspan, yspan)¶ Computes the aspect ratio of the plot
-
get_data(element, ranges, style)[source]¶ Returns the data from an element in the appropriate format for initializing or updating a ColumnDataSource and a dictionary which maps the expected keywords arguments of a glyph to the column in the datasource.
-
get_extents(element, ranges, range_type='combined', xdim=None, ydim=None, zdim=None)¶ Gets the extents for the axes from the current Element. The globally computed ranges can optionally override the extents.
The extents are computed by combining the data ranges, extents and dimension ranges. Each of these can be obtained individually by setting the range_type to one of:
‘data’: Just the data ranges
‘extents’: Element.extents
‘soft’: Dimension.soft_range values
‘hard’: Dimension.range values
To obtain the combined range, which includes range padding the default may be used:
‘combined’: All the range types combined and padding applied
This allows Overlay plots to obtain each range and combine them appropriately for all the objects in the overlay.
-
get_padding(obj, extents)¶ Computes padding along the axes taking into account the plot aspect.
-
get_zorder(overlay, key, el)¶ Computes the z-order of element in the NdOverlay taking into account possible batching of elements.
-
initialize_plot(ranges=None, plot=None, plots=None, source=None)¶ Initializes a new plot object with the last available frame.
-
property
link_sources¶ Returns potential Link or Stream sources.
-
matches(spec)¶ Matches a specification against the current Plot.
-
model_changed(model)¶ Determines if the bokeh model was just changed on the frontend. Useful to suppress boomeranging events, e.g. when the frontend just sent an update to the x_range this should not trigger an update on the backend.
-
push()¶ Pushes plot updates to the frontend.
-
refresh(**kwargs)¶ Refreshes the plot by rerendering it and then pushing the updated data if the plot has an associated Comm.
-
set_root(root)¶ Sets the root model on all subplots.
-
property
state¶ The plotting state that gets updated via the update method and used by the renderer to generate output.
-
sync_sources()¶ Syncs data sources between Elements, which draw data from the same object.
-
traverse(fn=None, specs=None, full_breadth=True)¶ Traverses any nested DimensionedPlot returning a list of all plots that match the specs. The specs should be supplied as a list of either Plot types or callables, which should return a boolean given the plot class.
-
update(key)¶ Update the internal state of the Plot to represent the given key tuple (where integers represent frames). Returns this state.
-
update_frame(key, ranges=None, plot=None, element=None)¶ Updates an existing plot with data corresponding to the key.
-
class
holoviews.plotting.bokeh.path.PolygonPlot(*args, **params)[source]¶ Bases:
holoviews.plotting.bokeh.path.ContourPlotParameters inherited from:
holoviews.plotting.plot.DimensionedPlot: fontscale, show_title, normalize, projectionholoviews.plotting.plot.GenericElementPlot: apply_ranges, apply_extents, bgcolor, default_span, hooks, invert_axes, invert_xaxis, invert_yaxis, finalize_hooks, logx, logy, padding, show_grid, xaxis, yaxis, xlabel, ylabel, xlim, ylim, zlim, xrotation, yrotation, xticks, yticksholoviews.plotting.bokeh.plot.BokehPlot: title, title_format, shared_datasourceholoviews.plotting.bokeh.element.ElementPlot: fontsize, toolbar, width, height, active_tools, align, border, aspect, data_aspect, frame_width, frame_height, min_width, min_height, max_width, max_height, margin, responsive, gridstyle, labelled, lod, show_frame, shared_axes, default_tools, tools, xformatter, yformatterholoviews.plotting.bokeh.element.ColorbarPlot: color_levels, clabel, clim, cformatter, colorbar, colorbar_position, colorbar_opts, clipping_colors, logz, symmetricholoviews.plotting.bokeh.element.LegendPlot: legend_position, legend_muted, legend_offset, legend_cols, legend_optsholoviews.plotting.bokeh.path.ContourPlot: show_legend, selected, color_index-
cleanup()¶ Cleans up references to the plot after the plot has been deleted. Traverses through all plots cleaning up Callbacks and Stream subscribers.
-
compute_ranges(obj, key, ranges)¶ Given an object, a specific key, and the normalization options, this method will find the specified normalization options on the appropriate OptionTree, group the elements according to the selected normalization option (i.e. either per frame or over the whole animation) and finally compute the dimension ranges in each group. The new set of ranges is returned.
-
property
current_handles¶ Should return a list of plot objects that have changed and should be updated.
-
property
framewise¶ Property to determine whether the current frame should have framewise normalization enabled. Required for bokeh plotting classes to determine whether to send updated ranges for each frame.
-
get_aspect(xspan, yspan)¶ Computes the aspect ratio of the plot
-
get_data(element, ranges, style)¶ Returns the data from an element in the appropriate format for initializing or updating a ColumnDataSource and a dictionary which maps the expected keywords arguments of a glyph to the column in the datasource.
-
get_extents(element, ranges, range_type='combined', xdim=None, ydim=None, zdim=None)¶ Gets the extents for the axes from the current Element. The globally computed ranges can optionally override the extents.
The extents are computed by combining the data ranges, extents and dimension ranges. Each of these can be obtained individually by setting the range_type to one of:
‘data’: Just the data ranges
‘extents’: Element.extents
‘soft’: Dimension.soft_range values
‘hard’: Dimension.range values
To obtain the combined range, which includes range padding the default may be used:
‘combined’: All the range types combined and padding applied
This allows Overlay plots to obtain each range and combine them appropriately for all the objects in the overlay.
-
get_padding(obj, extents)¶ Computes padding along the axes taking into account the plot aspect.
-
get_zorder(overlay, key, el)¶ Computes the z-order of element in the NdOverlay taking into account possible batching of elements.
-
initialize_plot(ranges=None, plot=None, plots=None, source=None)¶ Initializes a new plot object with the last available frame.
-
property
link_sources¶ Returns potential Link or Stream sources.
-
matches(spec)¶ Matches a specification against the current Plot.
-
model_changed(model)¶ Determines if the bokeh model was just changed on the frontend. Useful to suppress boomeranging events, e.g. when the frontend just sent an update to the x_range this should not trigger an update on the backend.
-
push()¶ Pushes plot updates to the frontend.
-
refresh(**kwargs)¶ Refreshes the plot by rerendering it and then pushing the updated data if the plot has an associated Comm.
-
set_root(root)¶ Sets the root model on all subplots.
-
property
state¶ The plotting state that gets updated via the update method and used by the renderer to generate output.
-
sync_sources()¶ Syncs data sources between Elements, which draw data from the same object.
-
traverse(fn=None, specs=None, full_breadth=True)¶ Traverses any nested DimensionedPlot returning a list of all plots that match the specs. The specs should be supplied as a list of either Plot types or callables, which should return a boolean given the plot class.
-
update(key)¶ Update the internal state of the Plot to represent the given key tuple (where integers represent frames). Returns this state.
-
update_frame(key, ranges=None, plot=None, element=None)¶ Updates an existing plot with data corresponding to the key.
-
plot Module

-
class
holoviews.plotting.bokeh.plot.AdjointLayoutPlot(layout, layout_type, subplots, **params)[source]¶ Bases:
holoviews.plotting.bokeh.plot.BokehPlot,holoviews.plotting.plot.GenericAdjointLayoutPlotParameters inherited from:
holoviews.plotting.plot.DimensionedPlot: fontsize, fontscale, show_title, normalize, projectionholoviews.plotting.bokeh.plot.BokehPlot: title, title_format, shared_datasource, toolbar, width, height-
cleanup()¶ Cleans up references to the plot after the plot has been deleted. Traverses through all plots cleaning up Callbacks and Stream subscribers.
-
compute_ranges(obj, key, ranges)¶ Given an object, a specific key, and the normalization options, this method will find the specified normalization options on the appropriate OptionTree, group the elements according to the selected normalization option (i.e. either per frame or over the whole animation) and finally compute the dimension ranges in each group. The new set of ranges is returned.
-
property
current_handles¶ Should return a list of plot objects that have changed and should be updated.
-
get_data(element, ranges, style)¶ Returns the data from an element in the appropriate format for initializing or updating a ColumnDataSource and a dictionary which maps the expected keywords arguments of a glyph to the column in the datasource.
-
initialize_plot(ranges=None, plots=[])[source]¶ Plot all the views contained in the AdjointLayout Object using axes appropriate to the layout configuration. All the axes are supplied by LayoutPlot - the purpose of the call is to invoke subplots with correct options and styles and hide any empty axes as necessary.
-
property
link_sources¶ Returns potential Link or Stream sources.
-
matches(spec)¶ Matches a specification against the current Plot.
-
push()¶ Pushes plot updates to the frontend.
-
refresh(**kwargs)¶ Refreshes the plot by rerendering it and then pushing the updated data if the plot has an associated Comm.
-
set_root(root)¶ Sets the root model on all subplots.
-
property
state¶ The plotting state that gets updated via the update method and used by the renderer to generate output.
-
sync_sources()¶ Syncs data sources between Elements, which draw data from the same object.
-
traverse(fn=None, specs=None, full_breadth=True)¶ Traverses any nested DimensionedPlot returning a list of all plots that match the specs. The specs should be supplied as a list of either Plot types or callables, which should return a boolean given the plot class.
-
update(key)¶ Update the internal state of the Plot to represent the given key tuple (where integers represent frames). Returns this state.
-
-
class
holoviews.plotting.bokeh.plot.BokehPlot(keys=None, dimensions=None, layout_dimensions=None, uniform=True, subplot=False, adjoined=None, layout_num=0, style=None, subplots=None, dynamic=False, **params)[source]¶ Bases:
holoviews.plotting.plot.DimensionedPlot,holoviews.plotting.plot.CallbackPlotPlotting baseclass for the Bokeh backends, implementing the basic plotting interface for Bokeh based plots.
Parameters inherited from:
holoviews.plotting.plot.DimensionedPlot: fontsize, fontscale, show_title, normalize, projectiontitle= param.String(default=’{label} {group} {dimensions}’)The formatting string for the title of this plot, allows defining a label group separator and dimension labels.
title_format= param.String()Alias for title.
shared_datasource= param.Boolean(bounds=(0, 1), default=True)Whether Elements drawing the data from the same object should share their Bokeh data source allowing for linked brushing and other linked behaviors.
toolbar= param.ObjectSelector(default=’above’, objects=[‘above’, ‘below’, ‘left’, ‘right’, None])The toolbar location, must be one of ‘above’, ‘below’, ‘left’, ‘right’, None.
width= param.Integer(bounds=(0, None), inclusive_bounds=(True, True))The width of the component (in pixels). This can be either fixed or preferred width, depending on width sizing policy.
height= param.Integer(bounds=(0, None), inclusive_bounds=(True, True))The height of the component (in pixels). This can be either fixed or preferred height, depending on height sizing policy.
-
cleanup()[source]¶ Cleans up references to the plot after the plot has been deleted. Traverses through all plots cleaning up Callbacks and Stream subscribers.
-
compute_ranges(obj, key, ranges)¶ Given an object, a specific key, and the normalization options, this method will find the specified normalization options on the appropriate OptionTree, group the elements according to the selected normalization option (i.e. either per frame or over the whole animation) and finally compute the dimension ranges in each group. The new set of ranges is returned.
-
property
current_handles¶ Should return a list of plot objects that have changed and should be updated.
-
get_data(element, ranges, style)[source]¶ Returns the data from an element in the appropriate format for initializing or updating a ColumnDataSource and a dictionary which maps the expected keywords arguments of a glyph to the column in the datasource.
-
initialize_plot(ranges=None)¶ Initialize the matplotlib figure.
-
property
link_sources¶ Returns potential Link or Stream sources.
-
matches(spec)¶ Matches a specification against the current Plot.
-
push()¶ Pushes plot updates to the frontend.
-
refresh(**kwargs)¶ Refreshes the plot by rerendering it and then pushing the updated data if the plot has an associated Comm.
-
set_root(root)¶ Sets the root model on all subplots.
-
property
state¶ The plotting state that gets updated via the update method and used by the renderer to generate output.
-
traverse(fn=None, specs=None, full_breadth=True)¶ Traverses any nested DimensionedPlot returning a list of all plots that match the specs. The specs should be supplied as a list of either Plot types or callables, which should return a boolean given the plot class.
-
update(key)¶ Update the internal state of the Plot to represent the given key tuple (where integers represent frames). Returns this state.
-
class
holoviews.plotting.bokeh.plot.CompositePlot(keys=None, dimensions=None, layout_dimensions=None, uniform=True, subplot=False, adjoined=None, layout_num=0, style=None, subplots=None, dynamic=False, **params)[source]¶ Bases:
holoviews.plotting.bokeh.plot.BokehPlotCompositePlot is an abstract baseclass for plot types that draw render multiple axes. It implements methods to add an overall title to such a plot.
Parameters inherited from:
holoviews.plotting.plot.DimensionedPlot: fontscale, show_title, normalize, projectionholoviews.plotting.bokeh.plot.BokehPlot: title, title_format, shared_datasource, toolbar, width, heightfontsize= param.Parameter(default={‘title’: ‘15pt’})Specifies various fontsizes of the displayed text. Finer control is available by supplying a dictionary where any unmentioned keys reverts to the default sizes, e.g: {‘title’: ‘15pt’}
sizing_mode= param.ObjectSelector(objects=[‘fixed’, ‘stretch_width’, ‘stretch_height’, ‘stretch_both’, ‘scale_width’, ‘scale_height’, ‘scale_both’, None])How the component should size itself. * “fixed” : Component is not responsive. It will retain its original width and height regardless of any subsequent browser window resize events. * “stretch_width” Component will responsively resize to stretch to the available width, without maintaining any aspect ratio. The height of the component depends on the type of the component and may be fixed or fit to component’s contents. * “stretch_height” Component will responsively resize to stretch to the available height, without maintaining any aspect ratio. The width of the component depends on the type of the component and may be fixed or fit to component’s contents. * “stretch_both” Component is completely responsive, independently in width and height, and will occupy all the available horizontal and vertical space, even if this changes the aspect ratio of the component. * “scale_width” Component will responsively resize to stretch to the available width, while maintaining the original or provided aspect ratio. * “scale_height” Component will responsively resize to stretch to the available height, while maintaining the original or provided aspect ratio. * “scale_both” Component will responsively resize to both the available width and height, while maintaining the original or provided aspect ratio.
-
cleanup()¶ Cleans up references to the plot after the plot has been deleted. Traverses through all plots cleaning up Callbacks and Stream subscribers.
-
compute_ranges(obj, key, ranges)¶ Given an object, a specific key, and the normalization options, this method will find the specified normalization options on the appropriate OptionTree, group the elements according to the selected normalization option (i.e. either per frame or over the whole animation) and finally compute the dimension ranges in each group. The new set of ranges is returned.
-
property
current_handles¶ Should return a list of plot objects that have changed and should be updated.
-
get_data(element, ranges, style)¶ Returns the data from an element in the appropriate format for initializing or updating a ColumnDataSource and a dictionary which maps the expected keywords arguments of a glyph to the column in the datasource.
-
initialize_plot(ranges=None)¶ Initialize the matplotlib figure.
-
property
link_sources¶ Returns potential Link or Stream sources.
-
matches(spec)¶ Matches a specification against the current Plot.
-
push()¶ Pushes plot updates to the frontend.
-
refresh(**kwargs)¶ Refreshes the plot by rerendering it and then pushing the updated data if the plot has an associated Comm.
-
set_root(root)¶ Sets the root model on all subplots.
-
property
state¶ The plotting state that gets updated via the update method and used by the renderer to generate output.
-
sync_sources()¶ Syncs data sources between Elements, which draw data from the same object.
-
traverse(fn=None, specs=None, full_breadth=True)¶ Traverses any nested DimensionedPlot returning a list of all plots that match the specs. The specs should be supplied as a list of either Plot types or callables, which should return a boolean given the plot class.
-
update(key)¶ Update the internal state of the Plot to represent the given key tuple (where integers represent frames). Returns this state.
-
class
holoviews.plotting.bokeh.plot.GridPlot(layout, ranges=None, layout_num=1, keys=None, **params)[source]¶ Bases:
holoviews.plotting.bokeh.plot.CompositePlot,holoviews.plotting.plot.GenericCompositePlotPlot a group of elements in a grid layout based on a GridSpace element object.
Parameters inherited from:
holoviews.plotting.plot.DimensionedPlot: fontscale, show_title, normalize, projectionholoviews.plotting.bokeh.plot.BokehPlot: title, title_format, shared_datasource, toolbar, width, heightholoviews.plotting.bokeh.plot.CompositePlot: sizing_modefontsize= param.Parameter(default={‘title’: ‘16pt’})Specifies various fontsizes of the displayed text. Finer control is available by supplying a dictionary where any unmentioned keys reverts to the default sizes, e.g: {‘title’: ‘15pt’}
axis_offset= param.Integer(default=50, inclusive_bounds=(True, True))Number of pixels to adjust row and column widths and height by to compensate for shared axes.
merge_tools= param.Boolean(bounds=(0, 1), default=True)Whether to merge all the tools into a single toolbar
shared_xaxis= param.Boolean(bounds=(0, 1), default=False)If enabled the x-axes of the GridSpace will be drawn from the objects inside the Grid rather than the GridSpace dimensions.
shared_yaxis= param.Boolean(bounds=(0, 1), default=False)If enabled the x-axes of the GridSpace will be drawn from the objects inside the Grid rather than the GridSpace dimensions.
show_legend= param.Boolean(bounds=(0, 1), default=False)Adds a legend based on the entries of the middle-right plot
xaxis= param.ObjectSelector(default=True, objects=[‘bottom’, ‘top’, None, True, False])Whether and where to display the xaxis, supported options are ‘bottom’, ‘top’ and None.
yaxis= param.ObjectSelector(default=True, objects=[‘left’, ‘right’, None, True, False])Whether and where to display the yaxis, supported options are ‘left’, ‘right’ and None.
xrotation= param.Integer(bounds=(0, 360), default=0, inclusive_bounds=(True, True))Rotation angle of the xticks.
yrotation= param.Integer(bounds=(0, 360), default=0, inclusive_bounds=(True, True))Rotation angle of the yticks.
plot_size= param.ClassSelector(class_=(<class ‘int’>, <class ‘tuple’>), default=120)Defines the width and height of each plot in the grid, either as a tuple specifying width and height or an integer for a square plot.
-
cleanup()¶ Cleans up references to the plot after the plot has been deleted. Traverses through all plots cleaning up Callbacks and Stream subscribers.
-
compute_ranges(obj, key, ranges)¶ Given an object, a specific key, and the normalization options, this method will find the specified normalization options on the appropriate OptionTree, group the elements according to the selected normalization option (i.e. either per frame or over the whole animation) and finally compute the dimension ranges in each group. The new set of ranges is returned.
-
property
current_handles¶ Should return a list of plot objects that have changed and should be updated.
-
get_data(element, ranges, style)¶ Returns the data from an element in the appropriate format for initializing or updating a ColumnDataSource and a dictionary which maps the expected keywords arguments of a glyph to the column in the datasource.
-
property
link_sources¶ Returns potential Link or Stream sources.
-
matches(spec)¶ Matches a specification against the current Plot.
-
push()¶ Pushes plot updates to the frontend.
-
refresh(**kwargs)¶ Refreshes the plot by rerendering it and then pushing the updated data if the plot has an associated Comm.
-
set_root(root)¶ Sets the root model on all subplots.
-
property
state¶ The plotting state that gets updated via the update method and used by the renderer to generate output.
-
sync_sources()¶ Syncs data sources between Elements, which draw data from the same object.
-
traverse(fn=None, specs=None, full_breadth=True)¶ Traverses any nested DimensionedPlot returning a list of all plots that match the specs. The specs should be supplied as a list of either Plot types or callables, which should return a boolean given the plot class.
-
update(key)¶ Update the internal state of the Plot to represent the given key tuple (where integers represent frames). Returns this state.
-
class
holoviews.plotting.bokeh.plot.LayoutPlot(layout, keys=None, **params)[source]¶ Bases:
holoviews.plotting.bokeh.plot.CompositePlot,holoviews.plotting.plot.GenericLayoutPlotParameters inherited from:
holoviews.plotting.plot.DimensionedPlot: fontscale, show_title, normalize, projectionholoviews.plotting.plot.GenericLayoutPlot: transposeholoviews.plotting.bokeh.plot.BokehPlot: title, title_format, toolbar, width, heightholoviews.plotting.bokeh.plot.CompositePlot: fontsize, sizing_modeshared_datasource= param.Boolean(bounds=(0, 1), default=False)Whether Elements drawing the data from the same object should share their Bokeh data source allowing for linked brushing and other linked behaviors.
shared_axes= param.Boolean(bounds=(0, 1), default=True)Whether axes should be shared across plots
merge_tools= param.Boolean(bounds=(0, 1), default=True)Whether to merge all the tools into a single toolbar
tabs= param.Boolean(bounds=(0, 1), default=False)Whether to display overlaid plots in separate panes
-
cleanup()¶ Cleans up references to the plot after the plot has been deleted. Traverses through all plots cleaning up Callbacks and Stream subscribers.
-
compute_ranges(obj, key, ranges)¶ Given an object, a specific key, and the normalization options, this method will find the specified normalization options on the appropriate OptionTree, group the elements according to the selected normalization option (i.e. either per frame or over the whole animation) and finally compute the dimension ranges in each group. The new set of ranges is returned.
-
property
current_handles¶ Should return a list of plot objects that have changed and should be updated.
-
get_data(element, ranges, style)¶ Returns the data from an element in the appropriate format for initializing or updating a ColumnDataSource and a dictionary which maps the expected keywords arguments of a glyph to the column in the datasource.
-
property
link_sources¶ Returns potential Link or Stream sources.
-
matches(spec)¶ Matches a specification against the current Plot.
-
push()¶ Pushes plot updates to the frontend.
-
refresh(**kwargs)¶ Refreshes the plot by rerendering it and then pushing the updated data if the plot has an associated Comm.
-
set_root(root)¶ Sets the root model on all subplots.
-
property
state¶ The plotting state that gets updated via the update method and used by the renderer to generate output.
-
sync_sources()¶ Syncs data sources between Elements, which draw data from the same object.
-
traverse(fn=None, specs=None, full_breadth=True)¶ Traverses any nested DimensionedPlot returning a list of all plots that match the specs. The specs should be supplied as a list of either Plot types or callables, which should return a boolean given the plot class.
-
update(key)¶ Update the internal state of the Plot to represent the given key tuple (where integers represent frames). Returns this state.
raster Module

-
class
holoviews.plotting.bokeh.raster.HSVPlot(element, plot=None, **params)[source]¶ Bases:
holoviews.plotting.bokeh.raster.RGBPlotParameters inherited from:
holoviews.plotting.plot.DimensionedPlot: fontscale, show_title, normalize, projectionholoviews.plotting.plot.GenericElementPlot: apply_ranges, apply_extents, bgcolor, default_span, hooks, invert_axes, invert_xaxis, invert_yaxis, finalize_hooks, logx, logy, show_legend, show_grid, xaxis, yaxis, xlabel, ylabel, xlim, ylim, zlim, xrotation, yrotation, xticks, yticksholoviews.plotting.bokeh.plot.BokehPlot: title, title_format, shared_datasourceholoviews.plotting.bokeh.element.ElementPlot: fontsize, toolbar, width, height, active_tools, align, border, aspect, data_aspect, frame_width, frame_height, min_width, min_height, max_width, max_height, margin, responsive, gridstyle, labelled, lod, show_frame, shared_axes, default_tools, tools, xformatter, yformatter-
cleanup()¶ Cleans up references to the plot after the plot has been deleted. Traverses through all plots cleaning up Callbacks and Stream subscribers.
-
compute_ranges(obj, key, ranges)¶ Given an object, a specific key, and the normalization options, this method will find the specified normalization options on the appropriate OptionTree, group the elements according to the selected normalization option (i.e. either per frame or over the whole animation) and finally compute the dimension ranges in each group. The new set of ranges is returned.
-
property
current_handles¶ Should return a list of plot objects that have changed and should be updated.
-
property
framewise¶ Property to determine whether the current frame should have framewise normalization enabled. Required for bokeh plotting classes to determine whether to send updated ranges for each frame.
-
get_aspect(xspan, yspan)¶ Computes the aspect ratio of the plot
-
get_data(element, ranges, style)[source]¶ Returns the data from an element in the appropriate format for initializing or updating a ColumnDataSource and a dictionary which maps the expected keywords arguments of a glyph to the column in the datasource.
-
get_extents(element, ranges, range_type='combined', xdim=None, ydim=None, zdim=None)¶ Gets the extents for the axes from the current Element. The globally computed ranges can optionally override the extents.
The extents are computed by combining the data ranges, extents and dimension ranges. Each of these can be obtained individually by setting the range_type to one of:
‘data’: Just the data ranges
‘extents’: Element.extents
‘soft’: Dimension.soft_range values
‘hard’: Dimension.range values
To obtain the combined range, which includes range padding the default may be used:
‘combined’: All the range types combined and padding applied
This allows Overlay plots to obtain each range and combine them appropriately for all the objects in the overlay.
-
get_padding(obj, extents)¶ Computes padding along the axes taking into account the plot aspect.
-
get_zorder(overlay, key, el)¶ Computes the z-order of element in the NdOverlay taking into account possible batching of elements.
-
initialize_plot(ranges=None, plot=None, plots=None, source=None)¶ Initializes a new plot object with the last available frame.
-
property
link_sources¶ Returns potential Link or Stream sources.
-
matches(spec)¶ Matches a specification against the current Plot.
-
model_changed(model)¶ Determines if the bokeh model was just changed on the frontend. Useful to suppress boomeranging events, e.g. when the frontend just sent an update to the x_range this should not trigger an update on the backend.
-
push()¶ Pushes plot updates to the frontend.
-
refresh(**kwargs)¶ Refreshes the plot by rerendering it and then pushing the updated data if the plot has an associated Comm.
-
set_root(root)¶ Sets the root model on all subplots.
-
property
state¶ The plotting state that gets updated via the update method and used by the renderer to generate output.
-
sync_sources()¶ Syncs data sources between Elements, which draw data from the same object.
-
traverse(fn=None, specs=None, full_breadth=True)¶ Traverses any nested DimensionedPlot returning a list of all plots that match the specs. The specs should be supplied as a list of either Plot types or callables, which should return a boolean given the plot class.
-
update(key)¶ Update the internal state of the Plot to represent the given key tuple (where integers represent frames). Returns this state.
-
update_frame(key, ranges=None, plot=None, element=None)¶ Updates an existing plot with data corresponding to the key.
-
-
class
holoviews.plotting.bokeh.raster.QuadMeshPlot(element, plot=None, **params)[source]¶ Bases:
holoviews.plotting.bokeh.element.ColorbarPlotParameters inherited from:
holoviews.plotting.plot.DimensionedPlot: fontscale, show_title, normalize, projectionholoviews.plotting.plot.GenericElementPlot: apply_ranges, apply_extents, bgcolor, default_span, hooks, invert_axes, invert_xaxis, invert_yaxis, finalize_hooks, logx, logy, show_grid, xaxis, yaxis, xlabel, ylabel, xlim, ylim, zlim, xrotation, yrotation, xticks, yticksholoviews.plotting.bokeh.plot.BokehPlot: title, title_format, shared_datasourceholoviews.plotting.bokeh.element.ElementPlot: fontsize, toolbar, width, height, active_tools, align, border, aspect, data_aspect, frame_width, frame_height, min_width, min_height, max_width, max_height, margin, responsive, gridstyle, labelled, lod, show_frame, shared_axes, default_tools, tools, xformatter, yformatterholoviews.plotting.bokeh.element.ColorbarPlot: color_levels, clabel, clim, cformatter, colorbar, colorbar_position, colorbar_opts, logz, symmetricpadding= param.ClassSelector(class_=(<class ‘int’>, <class ‘float’>, <class ‘tuple’>), default=0)Fraction by which to increase auto-ranged extents to make datapoints more visible around borders. To compute padding, the axis whose screen size is largest is chosen, and the range of that axis is increased by the specified fraction along each axis. Other axes are then padded ensuring that the amount of screen space devoted to padding is equal for all axes. If specified as a tuple, the int or float values in the tuple will be used for padding in each axis, in order (x,y or x,y,z). For example, for padding=0.2 on a 800x800-pixel plot, an x-axis with the range [0,10] will be padded by 20% to be [-1,11], while a y-axis with a range [0,1000] will be padded to be [-100,1100], which should make the padding be approximately the same number of pixels. But if the same plot is changed to have a height of only 200, the y-range will then be [-400,1400] so that the y-axis padding will still match that of the x-axis. It is also possible to declare non-equal padding value for the lower and upper bound of an axis by supplying nested tuples, e.g. padding=(0.1, (0, 0.1)) will pad the x-axis lower and upper bound as well as the y-axis upper bound by a fraction of 0.1 while the y-axis lower bound is not padded at all.
show_legend= param.Boolean(bounds=(0, 1), default=False)Whether to show legend for the plot.
clipping_colors= param.Dict(class_=<class ‘dict’>, default={‘NaN’: ‘transparent’})Dictionary to specify colors for clipped values, allows setting color for NaN values and for values above and below the min and max value. The min, max or NaN color may specify an RGB(A) color as a color hex string of the form #FFFFFF or #FFFFFFFF or a length 3 or length 4 tuple specifying values in the range 0-1 or a named HTML color.
-
cleanup()¶ Cleans up references to the plot after the plot has been deleted. Traverses through all plots cleaning up Callbacks and Stream subscribers.
-
compute_ranges(obj, key, ranges)¶ Given an object, a specific key, and the normalization options, this method will find the specified normalization options on the appropriate OptionTree, group the elements according to the selected normalization option (i.e. either per frame or over the whole animation) and finally compute the dimension ranges in each group. The new set of ranges is returned.
-
property
current_handles¶ Should return a list of plot objects that have changed and should be updated.
-
property
framewise¶ Property to determine whether the current frame should have framewise normalization enabled. Required for bokeh plotting classes to determine whether to send updated ranges for each frame.
-
get_aspect(xspan, yspan)¶ Computes the aspect ratio of the plot
-
get_data(element, ranges, style)[source]¶ Returns the data from an element in the appropriate format for initializing or updating a ColumnDataSource and a dictionary which maps the expected keywords arguments of a glyph to the column in the datasource.
-
get_extents(element, ranges, range_type='combined', xdim=None, ydim=None, zdim=None)¶ Gets the extents for the axes from the current Element. The globally computed ranges can optionally override the extents.
The extents are computed by combining the data ranges, extents and dimension ranges. Each of these can be obtained individually by setting the range_type to one of:
‘data’: Just the data ranges
‘extents’: Element.extents
‘soft’: Dimension.soft_range values
‘hard’: Dimension.range values
To obtain the combined range, which includes range padding the default may be used:
‘combined’: All the range types combined and padding applied
This allows Overlay plots to obtain each range and combine them appropriately for all the objects in the overlay.
-
get_padding(obj, extents)¶ Computes padding along the axes taking into account the plot aspect.
-
get_zorder(overlay, key, el)¶ Computes the z-order of element in the NdOverlay taking into account possible batching of elements.
-
initialize_plot(ranges=None, plot=None, plots=None, source=None)¶ Initializes a new plot object with the last available frame.
-
property
link_sources¶ Returns potential Link or Stream sources.
-
matches(spec)¶ Matches a specification against the current Plot.
-
model_changed(model)¶ Determines if the bokeh model was just changed on the frontend. Useful to suppress boomeranging events, e.g. when the frontend just sent an update to the x_range this should not trigger an update on the backend.
-
push()¶ Pushes plot updates to the frontend.
-
refresh(**kwargs)¶ Refreshes the plot by rerendering it and then pushing the updated data if the plot has an associated Comm.
-
set_root(root)¶ Sets the root model on all subplots.
-
property
state¶ The plotting state that gets updated via the update method and used by the renderer to generate output.
-
sync_sources()¶ Syncs data sources between Elements, which draw data from the same object.
-
traverse(fn=None, specs=None, full_breadth=True)¶ Traverses any nested DimensionedPlot returning a list of all plots that match the specs. The specs should be supplied as a list of either Plot types or callables, which should return a boolean given the plot class.
-
update(key)¶ Update the internal state of the Plot to represent the given key tuple (where integers represent frames). Returns this state.
-
update_frame(key, ranges=None, plot=None, element=None)¶ Updates an existing plot with data corresponding to the key.
-
class
holoviews.plotting.bokeh.raster.RGBPlot(element, plot=None, **params)[source]¶ Bases:
holoviews.plotting.bokeh.element.ElementPlotParameters inherited from:
holoviews.plotting.plot.DimensionedPlot: fontscale, show_title, normalize, projectionholoviews.plotting.plot.GenericElementPlot: apply_ranges, apply_extents, bgcolor, default_span, hooks, invert_axes, invert_xaxis, invert_yaxis, finalize_hooks, logx, logy, show_legend, show_grid, xaxis, yaxis, xlabel, ylabel, xlim, ylim, zlim, xrotation, yrotation, xticks, yticksholoviews.plotting.bokeh.plot.BokehPlot: title, title_format, shared_datasourceholoviews.plotting.bokeh.element.ElementPlot: fontsize, toolbar, width, height, active_tools, align, border, aspect, data_aspect, frame_width, frame_height, min_width, min_height, max_width, max_height, margin, responsive, gridstyle, labelled, lod, show_frame, shared_axes, default_tools, tools, xformatter, yformatterpadding= param.ClassSelector(class_=(<class ‘int’>, <class ‘float’>, <class ‘tuple’>), default=0)Fraction by which to increase auto-ranged extents to make datapoints more visible around borders. To compute padding, the axis whose screen size is largest is chosen, and the range of that axis is increased by the specified fraction along each axis. Other axes are then padded ensuring that the amount of screen space devoted to padding is equal for all axes. If specified as a tuple, the int or float values in the tuple will be used for padding in each axis, in order (x,y or x,y,z). For example, for padding=0.2 on a 800x800-pixel plot, an x-axis with the range [0,10] will be padded by 20% to be [-1,11], while a y-axis with a range [0,1000] will be padded to be [-100,1100], which should make the padding be approximately the same number of pixels. But if the same plot is changed to have a height of only 200, the y-range will then be [-400,1400] so that the y-axis padding will still match that of the x-axis. It is also possible to declare non-equal padding value for the lower and upper bound of an axis by supplying nested tuples, e.g. padding=(0.1, (0, 0.1)) will pad the x-axis lower and upper bound as well as the y-axis upper bound by a fraction of 0.1 while the y-axis lower bound is not padded at all.
-
cleanup()¶ Cleans up references to the plot after the plot has been deleted. Traverses through all plots cleaning up Callbacks and Stream subscribers.
-
compute_ranges(obj, key, ranges)¶ Given an object, a specific key, and the normalization options, this method will find the specified normalization options on the appropriate OptionTree, group the elements according to the selected normalization option (i.e. either per frame or over the whole animation) and finally compute the dimension ranges in each group. The new set of ranges is returned.
-
property
current_handles¶ Should return a list of plot objects that have changed and should be updated.
-
property
framewise¶ Property to determine whether the current frame should have framewise normalization enabled. Required for bokeh plotting classes to determine whether to send updated ranges for each frame.
-
get_aspect(xspan, yspan)¶ Computes the aspect ratio of the plot
-
get_data(element, ranges, style)[source]¶ Returns the data from an element in the appropriate format for initializing or updating a ColumnDataSource and a dictionary which maps the expected keywords arguments of a glyph to the column in the datasource.
-
get_extents(element, ranges, range_type='combined', xdim=None, ydim=None, zdim=None)¶ Gets the extents for the axes from the current Element. The globally computed ranges can optionally override the extents.
The extents are computed by combining the data ranges, extents and dimension ranges. Each of these can be obtained individually by setting the range_type to one of:
‘data’: Just the data ranges
‘extents’: Element.extents
‘soft’: Dimension.soft_range values
‘hard’: Dimension.range values
To obtain the combined range, which includes range padding the default may be used:
‘combined’: All the range types combined and padding applied
This allows Overlay plots to obtain each range and combine them appropriately for all the objects in the overlay.
-
get_padding(obj, extents)¶ Computes padding along the axes taking into account the plot aspect.
-
get_zorder(overlay, key, el)¶ Computes the z-order of element in the NdOverlay taking into account possible batching of elements.
-
initialize_plot(ranges=None, plot=None, plots=None, source=None)¶ Initializes a new plot object with the last available frame.
-
property
link_sources¶ Returns potential Link or Stream sources.
-
matches(spec)¶ Matches a specification against the current Plot.
-
model_changed(model)¶ Determines if the bokeh model was just changed on the frontend. Useful to suppress boomeranging events, e.g. when the frontend just sent an update to the x_range this should not trigger an update on the backend.
-
push()¶ Pushes plot updates to the frontend.
-
refresh(**kwargs)¶ Refreshes the plot by rerendering it and then pushing the updated data if the plot has an associated Comm.
-
set_root(root)¶ Sets the root model on all subplots.
-
property
state¶ The plotting state that gets updated via the update method and used by the renderer to generate output.
-
sync_sources()¶ Syncs data sources between Elements, which draw data from the same object.
-
traverse(fn=None, specs=None, full_breadth=True)¶ Traverses any nested DimensionedPlot returning a list of all plots that match the specs. The specs should be supplied as a list of either Plot types or callables, which should return a boolean given the plot class.
-
update(key)¶ Update the internal state of the Plot to represent the given key tuple (where integers represent frames). Returns this state.
-
update_frame(key, ranges=None, plot=None, element=None)¶ Updates an existing plot with data corresponding to the key.
-
class
holoviews.plotting.bokeh.raster.RasterPlot(*args, **kwargs)[source]¶ Bases:
holoviews.plotting.bokeh.element.ColorbarPlotParameters inherited from:
holoviews.plotting.plot.DimensionedPlot: fontscale, show_title, normalize, projectionholoviews.plotting.plot.GenericElementPlot: apply_ranges, apply_extents, bgcolor, default_span, hooks, invert_axes, invert_xaxis, invert_yaxis, finalize_hooks, logx, logy, show_grid, xaxis, yaxis, xlabel, ylabel, xlim, ylim, zlim, xrotation, yrotation, xticks, yticksholoviews.plotting.bokeh.plot.BokehPlot: title, title_format, shared_datasourceholoviews.plotting.bokeh.element.ElementPlot: fontsize, toolbar, width, height, active_tools, align, border, aspect, data_aspect, frame_width, frame_height, min_width, min_height, max_width, max_height, margin, responsive, gridstyle, labelled, lod, show_frame, shared_axes, default_tools, tools, xformatter, yformatterholoviews.plotting.bokeh.element.ColorbarPlot: color_levels, clabel, clim, cformatter, colorbar, colorbar_position, colorbar_opts, logz, symmetricpadding= param.ClassSelector(class_=(<class ‘int’>, <class ‘float’>, <class ‘tuple’>), default=0)Fraction by which to increase auto-ranged extents to make datapoints more visible around borders. To compute padding, the axis whose screen size is largest is chosen, and the range of that axis is increased by the specified fraction along each axis. Other axes are then padded ensuring that the amount of screen space devoted to padding is equal for all axes. If specified as a tuple, the int or float values in the tuple will be used for padding in each axis, in order (x,y or x,y,z). For example, for padding=0.2 on a 800x800-pixel plot, an x-axis with the range [0,10] will be padded by 20% to be [-1,11], while a y-axis with a range [0,1000] will be padded to be [-100,1100], which should make the padding be approximately the same number of pixels. But if the same plot is changed to have a height of only 200, the y-range will then be [-400,1400] so that the y-axis padding will still match that of the x-axis. It is also possible to declare non-equal padding value for the lower and upper bound of an axis by supplying nested tuples, e.g. padding=(0.1, (0, 0.1)) will pad the x-axis lower and upper bound as well as the y-axis upper bound by a fraction of 0.1 while the y-axis lower bound is not padded at all.
show_legend= param.Boolean(bounds=(0, 1), default=False)Whether to show legend for the plot.
clipping_colors= param.Dict(class_=<class ‘dict’>, default={‘NaN’: ‘transparent’})Dictionary to specify colors for clipped values, allows setting color for NaN values and for values above and below the min and max value. The min, max or NaN color may specify an RGB(A) color as a color hex string of the form #FFFFFF or #FFFFFFFF or a length 3 or length 4 tuple specifying values in the range 0-1 or a named HTML color.
-
cleanup()¶ Cleans up references to the plot after the plot has been deleted. Traverses through all plots cleaning up Callbacks and Stream subscribers.
-
compute_ranges(obj, key, ranges)¶ Given an object, a specific key, and the normalization options, this method will find the specified normalization options on the appropriate OptionTree, group the elements according to the selected normalization option (i.e. either per frame or over the whole animation) and finally compute the dimension ranges in each group. The new set of ranges is returned.
-
property
current_handles¶ Should return a list of plot objects that have changed and should be updated.
-
property
framewise¶ Property to determine whether the current frame should have framewise normalization enabled. Required for bokeh plotting classes to determine whether to send updated ranges for each frame.
-
get_aspect(xspan, yspan)¶ Computes the aspect ratio of the plot
-
get_data(element, ranges, style)[source]¶ Returns the data from an element in the appropriate format for initializing or updating a ColumnDataSource and a dictionary which maps the expected keywords arguments of a glyph to the column in the datasource.
-
get_extents(element, ranges, range_type='combined', xdim=None, ydim=None, zdim=None)¶ Gets the extents for the axes from the current Element. The globally computed ranges can optionally override the extents.
The extents are computed by combining the data ranges, extents and dimension ranges. Each of these can be obtained individually by setting the range_type to one of:
‘data’: Just the data ranges
‘extents’: Element.extents
‘soft’: Dimension.soft_range values
‘hard’: Dimension.range values
To obtain the combined range, which includes range padding the default may be used:
‘combined’: All the range types combined and padding applied
This allows Overlay plots to obtain each range and combine them appropriately for all the objects in the overlay.
-
get_padding(obj, extents)¶ Computes padding along the axes taking into account the plot aspect.
-
get_zorder(overlay, key, el)¶ Computes the z-order of element in the NdOverlay taking into account possible batching of elements.
-
initialize_plot(ranges=None, plot=None, plots=None, source=None)¶ Initializes a new plot object with the last available frame.
-
property
link_sources¶ Returns potential Link or Stream sources.
-
matches(spec)¶ Matches a specification against the current Plot.
-
model_changed(model)¶ Determines if the bokeh model was just changed on the frontend. Useful to suppress boomeranging events, e.g. when the frontend just sent an update to the x_range this should not trigger an update on the backend.
-
push()¶ Pushes plot updates to the frontend.
-
refresh(**kwargs)¶ Refreshes the plot by rerendering it and then pushing the updated data if the plot has an associated Comm.
-
set_root(root)¶ Sets the root model on all subplots.
-
property
state¶ The plotting state that gets updated via the update method and used by the renderer to generate output.
-
sync_sources()¶ Syncs data sources between Elements, which draw data from the same object.
-
traverse(fn=None, specs=None, full_breadth=True)¶ Traverses any nested DimensionedPlot returning a list of all plots that match the specs. The specs should be supplied as a list of either Plot types or callables, which should return a boolean given the plot class.
-
update(key)¶ Update the internal state of the Plot to represent the given key tuple (where integers represent frames). Returns this state.
-
update_frame(key, ranges=None, plot=None, element=None)¶ Updates an existing plot with data corresponding to the key.
renderer Module

-
class
holoviews.plotting.bokeh.renderer.BokehRenderer(*args, **params)[source]¶ Bases:
holoviews.plotting.renderer.RendererParameters inherited from:
holoviews.plotting.renderer.Renderer: key_fn, info_fn, center, dpi, fps, mode, size, widget_location, widget_mode, css, post_render_hooksbackend= param.String(default=’bokeh’)The backend name.
fig= param.ObjectSelector(default=’auto’, objects=[‘html’, ‘json’, ‘auto’, ‘png’])Output render format for static figures. If None, no figure rendering will occur.
holomap= param.ObjectSelector(default=’auto’, objects=[‘widgets’, ‘scrubber’, None, ‘gif’, ‘auto’])Output render multi-frame (typically animated) format. If None, no multi-frame rendering will occur.
theme= param.ClassSelector(class_=(<class ‘bokeh.themes.theme.Theme’>, <class ‘str’>), default=<bokeh.themes.theme.Theme object at 0x7faf15614690>)The applicable Bokeh Theme object (if any).
webgl= param.Boolean(bounds=(0, 1), default=False)Whether to render plots with WebGL if available
-
app(plot, show=False, new_window=False, websocket_origin=None, port=0)¶ Creates a bokeh app from a HoloViews object or plot. By default simply attaches the plot to bokeh’s curdoc and returns the Document, if show option is supplied creates an Application instance and displays it either in a browser window or inline if notebook extension has been loaded. Using the new_window option the app may be displayed in a new browser tab once the notebook extension has been loaded. A websocket origin is required when launching from an existing tornado server (such as the notebook) and it is not on the default port (‘localhost:8888’).
-
comm_manager¶ alias of
pyviz_comms.CommManager
-
components(obj, fmt=None, comm=True, **kwargs)¶ Returns data and metadata dictionaries containing HTML and JS components to include render in app, notebook, or standalone document.
-
classmethod
encode(entry)¶ Classmethod that applies conditional encoding based on mime-type. Given an entry as returned by __call__ return the data in the appropriate encoding.
-
export_widgets(obj, filename, fmt=None, template=None, json=False, json_path='', **kwargs)¶ Render and export object as a widget to a static HTML file. Allows supplying a custom template formatting string with fields to interpolate ‘js’, ‘css’ and the main ‘html’ containing the widget. Also provides options to export widget data to a json file in the supplied json_path (defaults to current path).
-
get_plot(obj, doc=None, renderer=None, **kwargs)[source]¶ Given a HoloViews Viewable return a corresponding plot instance. Allows supplying a document attach the plot to, useful when combining the bokeh model with another plot.
-
get_plot_state(obj, renderer=None, **kwargs)¶ Given a HoloViews Viewable return a corresponding plot state.
-
get_size(plot)[source]¶ Return the display size associated with a plot before rendering to any particular format. Used to generate appropriate HTML display.
Returns a tuple of (width, height) in pixels.
-
html(obj, fmt=None, css=None, resources='CDN', **kwargs)¶ Renders plot or data structure and wraps the output in HTML. The comm argument defines whether the HTML output includes code to initialize a Comm, if the plot supplies one.
-
classmethod
html_assets(core=True, extras=True, backends=None, script=False)¶ Deprecated: No longer needed
-
instance(**params)¶ Return an instance of this class, copying parameters from any existing instance provided.
-
classmethod
load_nb(inline=True)[source]¶ Loads any resources required for display of plots in the Jupyter notebook
-
classmethod
plot_options(obj, percent_size)[source]¶ Given a holoviews object and a percentage size, apply heuristics to compute a suitable figure size. For instance, scaling layouts and grids linearly can result in unwieldy figure sizes when there are a large number of elements. As ad hoc heuristics are used, this functionality is kept separate from the plotting classes themselves.
Used by the IPython Notebook display hooks and the save utility. Note that this can be overridden explicitly per object using the fig_size and size plot options.
-
classmethod
plotting_class(obj)¶ Given an object or Element class, return the suitable plotting class needed to render it with the current renderer.
-
pprint(imports=None, prefix='\n ', unknown_value='<?>', qualify=False, separator='')¶ Same as Parameterized.pprint, except that X.classname(Y is replaced with X.classname.instance(Y
-
save(obj, basename, fmt='auto', key={}, info={}, options=None, resources='inline', title=None, **kwargs)¶ Save a HoloViews object to file, either using an explicitly supplied format or to the appropriate default.
-
script_repr(imports=[], prefix=' ')¶ Same as Parameterized.script_repr, except that X.classname(Y is replaced with X.classname.instance(Y
-
server_doc(obj, doc=None)¶ Get a bokeh Document with the plot attached. May supply an existing doc, otherwise bokeh.io.curdoc() is used to attach the plot to the global document instance.
-
classmethod
state()¶ Context manager to handle global state for a backend, allowing Plot classes to temporarily override that state.
-
static_html(obj, fmt=None, template=None)¶ Generates a static HTML with the rendered object in the supplied format. Allows supplying a template formatting string with fields to interpolate ‘js’, ‘css’ and the main ‘html’.
-
classmethod
validate(options)¶ Validate an options dictionary for the renderer.
sankey Module

-
class
holoviews.plotting.bokeh.sankey.SankeyPlot(element, plot=None, **params)[source]¶ Bases:
holoviews.plotting.bokeh.graphs.GraphPlotParameters inherited from:
holoviews.plotting.plot.DimensionedPlot: fontscale, show_title, normalize, projectionholoviews.plotting.plot.GenericElementPlot: apply_ranges, apply_extents, bgcolor, default_span, hooks, invert_axes, invert_xaxis, invert_yaxis, finalize_hooks, logx, logy, padding, show_grid, xaxis, yaxis, xlabel, ylabel, xlim, ylim, zlim, xrotation, yrotation, xticks, yticksholoviews.plotting.bokeh.plot.BokehPlot: title, title_format, shared_datasourceholoviews.plotting.bokeh.element.ElementPlot: fontsize, toolbar, active_tools, align, border, aspect, data_aspect, frame_width, frame_height, min_width, min_height, max_width, max_height, margin, responsive, gridstyle, labelled, lod, show_frame, shared_axes, default_tools, xformatter, yformatterholoviews.plotting.bokeh.element.LegendPlot: legend_position, legend_muted, legend_offset, legend_cols, legend_optsholoviews.plotting.bokeh.element.ColorbarPlot: color_levels, clabel, clim, cformatter, colorbar, colorbar_position, colorbar_opts, clipping_colors, logz, symmetricholoviews.plotting.bokeh.graphs.GraphPlot: tools, arrowhead_length, directed, selection_policy, inspection_policy, edge_color_indexshow_legend= param.Boolean(bounds=(0, 1), default=False)Whether to show the values.
width= param.Integer(bounds=(0, None), default=1000, inclusive_bounds=(True, True))The width of the component (in pixels). This can be either fixed or preferred width, depending on width sizing policy.
height= param.Integer(bounds=(0, None), default=600, inclusive_bounds=(True, True))The height of the component (in pixels). This can be either fixed or preferred height, depending on height sizing policy.
color_index= param.ClassSelector(class_=(<class ‘str’>, <class ‘int’>), default=2)Index of the dimension from which the node labels will be drawn
labels= param.ClassSelector(class_=(<class ‘str’>, <class ‘holoviews.util.transform.dim’>))The dimension or dimension value transform used to draw labels from.
label_position= param.ObjectSelector(default=’right’, objects=[‘left’, ‘right’, ‘outer’, ‘inner’])Whether node labels should be placed to the left, right, outer or inner.
show_values= param.Boolean(bounds=(0, 1), default=True)Whether to show the values.
node_width= param.Number(default=15, inclusive_bounds=(True, True))Width of the nodes.
node_padding= param.Integer(inclusive_bounds=(True, True))Number of pixels of padding relative to the bounds.
iterations= param.Integer(default=32, inclusive_bounds=(True, True))Number of iterations to run the layout algorithm.
node_sort= param.Boolean(bounds=(0, 1), default=True)Sort nodes in ascending breadth.
label_index= param.ClassSelector(class_=(<class ‘str’>, <class ‘int’>), default=2)Index of the dimension from which the node labels will be drawn
-
cleanup()¶ Cleans up references to the plot after the plot has been deleted. Traverses through all plots cleaning up Callbacks and Stream subscribers.
-
compute_ranges(obj, key, ranges)¶ Given an object, a specific key, and the normalization options, this method will find the specified normalization options on the appropriate OptionTree, group the elements according to the selected normalization option (i.e. either per frame or over the whole animation) and finally compute the dimension ranges in each group. The new set of ranges is returned.
-
property
current_handles¶ Should return a list of plot objects that have changed and should be updated.
-
property
framewise¶ Property to determine whether the current frame should have framewise normalization enabled. Required for bokeh plotting classes to determine whether to send updated ranges for each frame.
-
get_aspect(xspan, yspan)¶ Computes the aspect ratio of the plot
-
get_data(element, ranges, style)[source]¶ Returns the data from an element in the appropriate format for initializing or updating a ColumnDataSource and a dictionary which maps the expected keywords arguments of a glyph to the column in the datasource.
-
get_padding(obj, extents)¶ Computes padding along the axes taking into account the plot aspect.
-
get_zorder(overlay, key, el)¶ Computes the z-order of element in the NdOverlay taking into account possible batching of elements.
-
initialize_plot(ranges=None, plot=None, plots=None, source=None)¶ Initializes a new plot object with the last available frame.
-
property
link_sources¶ Returns potential Link or Stream sources.
-
matches(spec)¶ Matches a specification against the current Plot.
-
model_changed(model)¶ Determines if the bokeh model was just changed on the frontend. Useful to suppress boomeranging events, e.g. when the frontend just sent an update to the x_range this should not trigger an update on the backend.
-
push()¶ Pushes plot updates to the frontend.
-
refresh(**kwargs)¶ Refreshes the plot by rerendering it and then pushing the updated data if the plot has an associated Comm.
-
set_root(root)¶ Sets the root model on all subplots.
-
property
state¶ The plotting state that gets updated via the update method and used by the renderer to generate output.
-
sync_sources()¶ Syncs data sources between Elements, which draw data from the same object.
-
traverse(fn=None, specs=None, full_breadth=True)¶ Traverses any nested DimensionedPlot returning a list of all plots that match the specs. The specs should be supplied as a list of either Plot types or callables, which should return a boolean given the plot class.
-
update(key)¶ Update the internal state of the Plot to represent the given key tuple (where integers represent frames). Returns this state.
-
update_frame(key, ranges=None, plot=None, element=None)¶ Updates an existing plot with data corresponding to the key.
selection Module

-
class
holoviews.plotting.bokeh.selection.BokehOverlaySelectionDisplay(color_prop='color', is_cmap=False, supports_region=True)[source]¶ Bases:
holoviews.selection.OverlaySelectionDisplayOverlay selection display subclass for use with bokeh backend
stats Module

-
class
holoviews.plotting.bokeh.stats.BivariatePlot(*args, **params)[source]¶ Bases:
holoviews.plotting.bokeh.path.PolygonPlotBivariate plot visualizes two-dimensional kernel density estimates. Additionally, by enabling the joint option, the marginals distributions can be plotted alongside each axis (does not animate or compose).
Parameters inherited from:
holoviews.plotting.plot.DimensionedPlot: fontscale, show_title, normalize, projectionholoviews.plotting.plot.GenericElementPlot: apply_ranges, apply_extents, bgcolor, default_span, hooks, invert_axes, invert_xaxis, invert_yaxis, finalize_hooks, logx, logy, padding, show_grid, xaxis, yaxis, xlabel, ylabel, xlim, ylim, zlim, xrotation, yrotation, xticks, yticksholoviews.plotting.bokeh.plot.BokehPlot: title, title_format, shared_datasourceholoviews.plotting.bokeh.element.ElementPlot: fontsize, toolbar, width, height, active_tools, align, border, aspect, data_aspect, frame_width, frame_height, min_width, min_height, max_width, max_height, margin, responsive, gridstyle, labelled, lod, show_frame, shared_axes, default_tools, tools, xformatter, yformatterholoviews.plotting.bokeh.element.ColorbarPlot: color_levels, clabel, clim, cformatter, colorbar, colorbar_position, colorbar_opts, clipping_colors, logz, symmetricholoviews.plotting.bokeh.element.LegendPlot: legend_position, legend_muted, legend_offset, legend_cols, legend_optsholoviews.plotting.bokeh.path.ContourPlot: show_legend, selected, color_indexbandwidth= param.Number(inclusive_bounds=(True, True))The bandwidth of the kernel for the density estimate.
cut= param.Number(default=3, inclusive_bounds=(True, True))Draw the estimate to cut * bw from the extreme data points.
filled= param.Boolean(bounds=(0, 1), default=False)Whether the bivariate contours should be filled.
levels= param.ClassSelector(class_=(<class ‘list’>, <class ‘int’>), default=10)A list of scalar values used to specify the contour levels.
-
cleanup()¶ Cleans up references to the plot after the plot has been deleted. Traverses through all plots cleaning up Callbacks and Stream subscribers.
-
compute_ranges(obj, key, ranges)¶ Given an object, a specific key, and the normalization options, this method will find the specified normalization options on the appropriate OptionTree, group the elements according to the selected normalization option (i.e. either per frame or over the whole animation) and finally compute the dimension ranges in each group. The new set of ranges is returned.
-
property
current_handles¶ Should return a list of plot objects that have changed and should be updated.
-
property
framewise¶ Property to determine whether the current frame should have framewise normalization enabled. Required for bokeh plotting classes to determine whether to send updated ranges for each frame.
-
get_aspect(xspan, yspan)¶ Computes the aspect ratio of the plot
-
get_data(element, ranges, style)¶ Returns the data from an element in the appropriate format for initializing or updating a ColumnDataSource and a dictionary which maps the expected keywords arguments of a glyph to the column in the datasource.
-
get_extents(element, ranges, range_type='combined', xdim=None, ydim=None, zdim=None)¶ Gets the extents for the axes from the current Element. The globally computed ranges can optionally override the extents.
The extents are computed by combining the data ranges, extents and dimension ranges. Each of these can be obtained individually by setting the range_type to one of:
‘data’: Just the data ranges
‘extents’: Element.extents
‘soft’: Dimension.soft_range values
‘hard’: Dimension.range values
To obtain the combined range, which includes range padding the default may be used:
‘combined’: All the range types combined and padding applied
This allows Overlay plots to obtain each range and combine them appropriately for all the objects in the overlay.
-
get_padding(obj, extents)¶ Computes padding along the axes taking into account the plot aspect.
-
get_zorder(overlay, key, el)¶ Computes the z-order of element in the NdOverlay taking into account possible batching of elements.
-
initialize_plot(ranges=None, plot=None, plots=None, source=None)¶ Initializes a new plot object with the last available frame.
-
property
link_sources¶ Returns potential Link or Stream sources.
-
matches(spec)¶ Matches a specification against the current Plot.
-
model_changed(model)¶ Determines if the bokeh model was just changed on the frontend. Useful to suppress boomeranging events, e.g. when the frontend just sent an update to the x_range this should not trigger an update on the backend.
-
push()¶ Pushes plot updates to the frontend.
-
refresh(**kwargs)¶ Refreshes the plot by rerendering it and then pushing the updated data if the plot has an associated Comm.
-
set_root(root)¶ Sets the root model on all subplots.
-
property
state¶ The plotting state that gets updated via the update method and used by the renderer to generate output.
-
sync_sources()¶ Syncs data sources between Elements, which draw data from the same object.
-
traverse(fn=None, specs=None, full_breadth=True)¶ Traverses any nested DimensionedPlot returning a list of all plots that match the specs. The specs should be supplied as a list of either Plot types or callables, which should return a boolean given the plot class.
-
update(key)¶ Update the internal state of the Plot to represent the given key tuple (where integers represent frames). Returns this state.
-
update_frame(key, ranges=None, plot=None, element=None)¶ Updates an existing plot with data corresponding to the key.
-
class
holoviews.plotting.bokeh.stats.BoxWhiskerPlot(element, plot=None, **params)[source]¶ Bases:
holoviews.plotting.bokeh.element.CompositeElementPlot,holoviews.plotting.bokeh.element.ColorbarPlot,holoviews.plotting.bokeh.element.LegendPlotParameters inherited from:
holoviews.plotting.plot.DimensionedPlot: fontscale, show_title, normalize, projectionholoviews.plotting.plot.GenericElementPlot: apply_ranges, apply_extents, bgcolor, default_span, hooks, invert_axes, invert_xaxis, invert_yaxis, finalize_hooks, logx, logy, padding, show_grid, xaxis, yaxis, xlabel, ylabel, xlim, ylim, zlim, xrotation, yrotation, xticks, yticksholoviews.plotting.bokeh.plot.BokehPlot: title, title_format, shared_datasourceholoviews.plotting.bokeh.element.ElementPlot: fontsize, toolbar, width, height, active_tools, align, border, aspect, data_aspect, frame_width, frame_height, min_width, min_height, max_width, max_height, margin, responsive, gridstyle, labelled, lod, show_frame, shared_axes, default_tools, tools, xformatter, yformatterholoviews.plotting.bokeh.element.LegendPlot: legend_position, legend_muted, legend_offset, legend_cols, legend_optsholoviews.plotting.bokeh.element.ColorbarPlot: color_levels, clabel, clim, cformatter, colorbar, colorbar_position, colorbar_opts, clipping_colors, logz, symmetricshow_legend= param.Boolean(bounds=(0, 1), default=False)Whether to show legend for the plot.
color_index= param.ClassSelector(class_=(<class ‘str’>, <class ‘int’>))Deprecated in favor of color style mapping, e.g. box_color=dim(‘color’)
-
cleanup()¶ Cleans up references to the plot after the plot has been deleted. Traverses through all plots cleaning up Callbacks and Stream subscribers.
-
compute_ranges(obj, key, ranges)¶ Given an object, a specific key, and the normalization options, this method will find the specified normalization options on the appropriate OptionTree, group the elements according to the selected normalization option (i.e. either per frame or over the whole animation) and finally compute the dimension ranges in each group. The new set of ranges is returned.
-
property
current_handles¶ Should return a list of plot objects that have changed and should be updated.
-
property
framewise¶ Property to determine whether the current frame should have framewise normalization enabled. Required for bokeh plotting classes to determine whether to send updated ranges for each frame.
-
get_aspect(xspan, yspan)¶ Computes the aspect ratio of the plot
-
get_data(element, ranges, style)[source]¶ Returns the data from an element in the appropriate format for initializing or updating a ColumnDataSource and a dictionary which maps the expected keywords arguments of a glyph to the column in the datasource.
-
get_extents(element, ranges, range_type='combined')[source]¶ Gets the extents for the axes from the current Element. The globally computed ranges can optionally override the extents.
The extents are computed by combining the data ranges, extents and dimension ranges. Each of these can be obtained individually by setting the range_type to one of:
‘data’: Just the data ranges
‘extents’: Element.extents
‘soft’: Dimension.soft_range values
‘hard’: Dimension.range values
To obtain the combined range, which includes range padding the default may be used:
‘combined’: All the range types combined and padding applied
This allows Overlay plots to obtain each range and combine them appropriately for all the objects in the overlay.
-
get_padding(obj, extents)¶ Computes padding along the axes taking into account the plot aspect.
-
get_zorder(overlay, key, el)¶ Computes the z-order of element in the NdOverlay taking into account possible batching of elements.
-
initialize_plot(ranges=None, plot=None, plots=None, source=None)¶ Initializes a new plot object with the last available frame.
-
property
link_sources¶ Returns potential Link or Stream sources.
-
matches(spec)¶ Matches a specification against the current Plot.
-
model_changed(model)¶ Determines if the bokeh model was just changed on the frontend. Useful to suppress boomeranging events, e.g. when the frontend just sent an update to the x_range this should not trigger an update on the backend.
-
push()¶ Pushes plot updates to the frontend.
-
refresh(**kwargs)¶ Refreshes the plot by rerendering it and then pushing the updated data if the plot has an associated Comm.
-
set_root(root)¶ Sets the root model on all subplots.
-
property
state¶ The plotting state that gets updated via the update method and used by the renderer to generate output.
-
sync_sources()¶ Syncs data sources between Elements, which draw data from the same object.
-
traverse(fn=None, specs=None, full_breadth=True)¶ Traverses any nested DimensionedPlot returning a list of all plots that match the specs. The specs should be supplied as a list of either Plot types or callables, which should return a boolean given the plot class.
-
update(key)¶ Update the internal state of the Plot to represent the given key tuple (where integers represent frames). Returns this state.
-
update_frame(key, ranges=None, plot=None, element=None)¶ Updates an existing plot with data corresponding to the key.
-
class
holoviews.plotting.bokeh.stats.DistributionPlot(element, plot=None, **params)[source]¶ Bases:
holoviews.plotting.bokeh.chart.AreaPlotDistributionPlot visualizes a distribution of values as a KDE.
Parameters inherited from:
holoviews.plotting.plot.DimensionedPlot: fontscale, show_title, normalize, projectionholoviews.plotting.plot.GenericElementPlot: apply_ranges, apply_extents, bgcolor, default_span, hooks, invert_axes, invert_xaxis, invert_yaxis, finalize_hooks, logx, logy, show_legend, show_grid, xaxis, yaxis, xlabel, ylabel, xlim, ylim, zlim, xrotation, yrotation, xticks, yticksholoviews.plotting.bokeh.plot.BokehPlot: title, title_format, shared_datasourceholoviews.plotting.bokeh.element.ElementPlot: fontsize, toolbar, width, height, active_tools, align, border, aspect, data_aspect, frame_width, frame_height, min_width, min_height, max_width, max_height, margin, responsive, gridstyle, labelled, lod, show_frame, shared_axes, default_tools, tools, xformatter, yformatterbandwidth= param.Number(inclusive_bounds=(True, True))The bandwidth of the kernel for the density estimate.
cut= param.Number(default=3, inclusive_bounds=(True, True))Draw the estimate to cut * bw from the extreme data points.
filled= param.Boolean(bounds=(0, 1), default=True)Whether the bivariate contours should be filled.
-
cleanup()¶ Cleans up references to the plot after the plot has been deleted. Traverses through all plots cleaning up Callbacks and Stream subscribers.
-
compute_ranges(obj, key, ranges)¶ Given an object, a specific key, and the normalization options, this method will find the specified normalization options on the appropriate OptionTree, group the elements according to the selected normalization option (i.e. either per frame or over the whole animation) and finally compute the dimension ranges in each group. The new set of ranges is returned.
-
property
current_handles¶ Should return a list of plot objects that have changed and should be updated.
-
property
framewise¶ Property to determine whether the current frame should have framewise normalization enabled. Required for bokeh plotting classes to determine whether to send updated ranges for each frame.
-
get_aspect(xspan, yspan)¶ Computes the aspect ratio of the plot
-
get_data(element, ranges, style)¶ Returns the data from an element in the appropriate format for initializing or updating a ColumnDataSource and a dictionary which maps the expected keywords arguments of a glyph to the column in the datasource.
-
get_padding(obj, extents)¶ Computes padding along the axes taking into account the plot aspect.
-
get_zorder(overlay, key, el)¶ Computes the z-order of element in the NdOverlay taking into account possible batching of elements.
-
initialize_plot(ranges=None, plot=None, plots=None, source=None)¶ Initializes a new plot object with the last available frame.
-
property
link_sources¶ Returns potential Link or Stream sources.
-
matches(spec)¶ Matches a specification against the current Plot.
-
model_changed(model)¶ Determines if the bokeh model was just changed on the frontend. Useful to suppress boomeranging events, e.g. when the frontend just sent an update to the x_range this should not trigger an update on the backend.
-
push()¶ Pushes plot updates to the frontend.
-
refresh(**kwargs)¶ Refreshes the plot by rerendering it and then pushing the updated data if the plot has an associated Comm.
-
set_root(root)¶ Sets the root model on all subplots.
-
property
state¶ The plotting state that gets updated via the update method and used by the renderer to generate output.
-
sync_sources()¶ Syncs data sources between Elements, which draw data from the same object.
-
traverse(fn=None, specs=None, full_breadth=True)¶ Traverses any nested DimensionedPlot returning a list of all plots that match the specs. The specs should be supplied as a list of either Plot types or callables, which should return a boolean given the plot class.
-
update(key)¶ Update the internal state of the Plot to represent the given key tuple (where integers represent frames). Returns this state.
-
update_frame(key, ranges=None, plot=None, element=None)¶ Updates an existing plot with data corresponding to the key.
-
class
holoviews.plotting.bokeh.stats.ViolinPlot(element, plot=None, **params)[source]¶ Bases:
holoviews.plotting.bokeh.stats.BoxWhiskerPlotParameters inherited from:
holoviews.plotting.plot.DimensionedPlot: fontscale, show_title, normalize, projectionholoviews.plotting.plot.GenericElementPlot: apply_ranges, apply_extents, bgcolor, default_span, hooks, invert_axes, invert_xaxis, invert_yaxis, finalize_hooks, logx, logy, padding, show_grid, xaxis, yaxis, xlabel, ylabel, xlim, ylim, zlim, xrotation, yrotation, xticks, yticksholoviews.plotting.bokeh.plot.BokehPlot: title, title_format, shared_datasourceholoviews.plotting.bokeh.element.ElementPlot: fontsize, toolbar, width, height, active_tools, align, border, aspect, data_aspect, frame_width, frame_height, min_width, min_height, max_width, max_height, margin, responsive, gridstyle, labelled, lod, show_frame, shared_axes, default_tools, tools, xformatter, yformatterholoviews.plotting.bokeh.element.LegendPlot: legend_position, legend_muted, legend_offset, legend_cols, legend_optsholoviews.plotting.bokeh.element.ColorbarPlot: color_levels, clabel, clim, cformatter, colorbar, colorbar_position, colorbar_opts, clipping_colors, logz, symmetricholoviews.plotting.bokeh.stats.BoxWhiskerPlot: show_legendcolor_index= param.ClassSelector(class_=(<class ‘str’>, <class ‘int’>))Deprecated in favor of color style mapping, e.g. violin_color=dim(‘color’)
bandwidth= param.Number(inclusive_bounds=(True, True))Allows supplying explicit bandwidth value rather than relying on scott or silverman method.
clip= param.NumericTuple(length=2)A tuple of a lower and upper bound to clip the violin at.
cut= param.Number(default=5, inclusive_bounds=(True, True))Draw the estimate to cut * bw from the extreme data points.
inner= param.ObjectSelector(default=’box’, objects=[‘box’, ‘quartiles’, ‘stick’, None])Inner visual indicator for distribution values: * box - A small box plot * stick - Lines indicating each sample value * quartiles - Indicates first, second and third quartiles
split= param.ClassSelector(class_=(<class ‘str’>, <class ‘holoviews.util.transform.dim’>))The dimension to split the Violin on.
violin_width= param.Number(default=0.8, inclusive_bounds=(True, True))Relative width of the violin
-
cleanup()¶ Cleans up references to the plot after the plot has been deleted. Traverses through all plots cleaning up Callbacks and Stream subscribers.
-
compute_ranges(obj, key, ranges)¶ Given an object, a specific key, and the normalization options, this method will find the specified normalization options on the appropriate OptionTree, group the elements according to the selected normalization option (i.e. either per frame or over the whole animation) and finally compute the dimension ranges in each group. The new set of ranges is returned.
-
property
current_handles¶ Should return a list of plot objects that have changed and should be updated.
-
property
framewise¶ Property to determine whether the current frame should have framewise normalization enabled. Required for bokeh plotting classes to determine whether to send updated ranges for each frame.
-
get_aspect(xspan, yspan)¶ Computes the aspect ratio of the plot
-
get_data(element, ranges, style)[source]¶ Returns the data from an element in the appropriate format for initializing or updating a ColumnDataSource and a dictionary which maps the expected keywords arguments of a glyph to the column in the datasource.
-
get_extents(element, ranges, range_type='combined')¶ Gets the extents for the axes from the current Element. The globally computed ranges can optionally override the extents.
The extents are computed by combining the data ranges, extents and dimension ranges. Each of these can be obtained individually by setting the range_type to one of:
‘data’: Just the data ranges
‘extents’: Element.extents
‘soft’: Dimension.soft_range values
‘hard’: Dimension.range values
To obtain the combined range, which includes range padding the default may be used:
‘combined’: All the range types combined and padding applied
This allows Overlay plots to obtain each range and combine them appropriately for all the objects in the overlay.
-
get_padding(obj, extents)¶ Computes padding along the axes taking into account the plot aspect.
-
get_zorder(overlay, key, el)¶ Computes the z-order of element in the NdOverlay taking into account possible batching of elements.
-
initialize_plot(ranges=None, plot=None, plots=None, source=None)¶ Initializes a new plot object with the last available frame.
-
property
link_sources¶ Returns potential Link or Stream sources.
-
matches(spec)¶ Matches a specification against the current Plot.
-
model_changed(model)¶ Determines if the bokeh model was just changed on the frontend. Useful to suppress boomeranging events, e.g. when the frontend just sent an update to the x_range this should not trigger an update on the backend.
-
push()¶ Pushes plot updates to the frontend.
-
refresh(**kwargs)¶ Refreshes the plot by rerendering it and then pushing the updated data if the plot has an associated Comm.
-
set_root(root)¶ Sets the root model on all subplots.
-
property
state¶ The plotting state that gets updated via the update method and used by the renderer to generate output.
-
sync_sources()¶ Syncs data sources between Elements, which draw data from the same object.
-
traverse(fn=None, specs=None, full_breadth=True)¶ Traverses any nested DimensionedPlot returning a list of all plots that match the specs. The specs should be supplied as a list of either Plot types or callables, which should return a boolean given the plot class.
-
update(key)¶ Update the internal state of the Plot to represent the given key tuple (where integers represent frames). Returns this state.
-
update_frame(key, ranges=None, plot=None, element=None)¶ Updates an existing plot with data corresponding to the key.
styles Module
Defines valid style options, validation and utilities
-
holoviews.plotting.bokeh.styles.expand_batched_style(style, opts, mapping, nvals)[source]¶ Computes styles applied to a batched plot by iterating over the supplied list of style options and expanding any options found in the supplied style dictionary returning a data and mapping defining the data that should be added to the ColumnDataSource.
-
holoviews.plotting.bokeh.styles.mpl_to_bokeh(properties)[source]¶ Utility to process style properties converting any matplotlib specific options to their nearest bokeh equivalent.
-
holoviews.plotting.bokeh.styles.rgba_tuple(rgba)[source]¶ Ensures RGB(A) tuples in the range 0-1 are scaled to 0-255.
-
holoviews.plotting.bokeh.styles.validate(style, value, scalar=False)[source]¶ Validates a style and associated value.
- style: str
The style to validate (e.g. ‘color’, ‘size’ or ‘marker’)
- value:
The style value to validate
scalar: bool
- valid: boolean or None
If validation is supported returns boolean, otherwise None
tabular Module

-
class
holoviews.plotting.bokeh.tabular.TablePlot(element, plot=None, **params)[source]¶ Bases:
holoviews.plotting.bokeh.plot.BokehPlot,holoviews.plotting.plot.GenericElementPlotParameters inherited from:
holoviews.plotting.plot.DimensionedPlot: fontsize, fontscale, show_title, normalize, projectionholoviews.plotting.plot.GenericElementPlot: apply_ranges, apply_extents, bgcolor, default_span, invert_axes, invert_xaxis, invert_yaxis, logx, logy, padding, show_legend, show_grid, xaxis, yaxis, xlabel, ylabel, xlim, ylim, zlim, xrotation, yrotation, xticks, yticksholoviews.plotting.bokeh.plot.BokehPlot: title, title_format, shared_datasource, toolbarhooks= param.HookList(bounds=(0, None), default=[])Optional list of hooks called when finalizing a plot. The hook is passed the plot object and the displayed element, and other plotting handles can be accessed via plot.handles.
finalize_hooks= param.HookList(bounds=(0, None), default=[])Deprecated; use hooks options instead.
width= param.Number(bounds=(0, None), default=400, inclusive_bounds=(True, True))The width of the component (in pixels). This can be either fixed or preferred width, depending on width sizing policy.
height= param.Number(bounds=(0, None), default=300, inclusive_bounds=(True, True))The height of the component (in pixels). This can be either fixed or preferred height, depending on height sizing policy.
selected= param.List(bounds=(0, None))The current selection as a list of integers corresponding to the selected items.
-
cleanup()¶ Cleans up references to the plot after the plot has been deleted. Traverses through all plots cleaning up Callbacks and Stream subscribers.
-
compute_ranges(obj, key, ranges)¶ Given an object, a specific key, and the normalization options, this method will find the specified normalization options on the appropriate OptionTree, group the elements according to the selected normalization option (i.e. either per frame or over the whole animation) and finally compute the dimension ranges in each group. The new set of ranges is returned.
-
property
current_handles¶ Should return a list of plot objects that have changed and should be updated.
-
get_aspect(xspan, yspan)¶ Should define the aspect ratio of the plot.
-
get_data(element, ranges, style)[source]¶ Returns the data from an element in the appropriate format for initializing or updating a ColumnDataSource and a dictionary which maps the expected keywords arguments of a glyph to the column in the datasource.
-
get_extents(element, ranges, range_type='combined', xdim=None, ydim=None, zdim=None)¶ Gets the extents for the axes from the current Element. The globally computed ranges can optionally override the extents.
The extents are computed by combining the data ranges, extents and dimension ranges. Each of these can be obtained individually by setting the range_type to one of:
‘data’: Just the data ranges
‘extents’: Element.extents
‘soft’: Dimension.soft_range values
‘hard’: Dimension.range values
To obtain the combined range, which includes range padding the default may be used:
‘combined’: All the range types combined and padding applied
This allows Overlay plots to obtain each range and combine them appropriately for all the objects in the overlay.
-
get_padding(obj, extents)¶ Computes padding along the axes taking into account the plot aspect.
-
get_zorder(overlay, key, el)¶ Computes the z-order of element in the NdOverlay taking into account possible batching of elements.
-
initialize_plot(ranges=None, plot=None, plots=None, source=None)[source]¶ Initializes a new plot object with the last available frame.
-
property
link_sources¶ Returns potential Link or Stream sources.
-
matches(spec)¶ Matches a specification against the current Plot.
-
push()¶ Pushes plot updates to the frontend.
-
refresh(**kwargs)¶ Refreshes the plot by rerendering it and then pushing the updated data if the plot has an associated Comm.
-
set_root(root)¶ Sets the root model on all subplots.
-
property
state¶ The plotting state that gets updated via the update method and used by the renderer to generate output.
-
sync_sources()¶ Syncs data sources between Elements, which draw data from the same object.
-
traverse(fn=None, specs=None, full_breadth=True)¶ Traverses any nested DimensionedPlot returning a list of all plots that match the specs. The specs should be supplied as a list of either Plot types or callables, which should return a boolean given the plot class.
-
update(key)¶ Update the internal state of the Plot to represent the given key tuple (where integers represent frames). Returns this state.
tiles Module

-
class
holoviews.plotting.bokeh.tiles.TilePlot(element, plot=None, **params)[source]¶ Bases:
holoviews.plotting.bokeh.element.ElementPlotParameters inherited from:
holoviews.plotting.plot.DimensionedPlot: fontscale, show_title, normalize, projectionholoviews.plotting.plot.GenericElementPlot: apply_ranges, apply_extents, bgcolor, default_span, hooks, invert_axes, invert_xaxis, invert_yaxis, finalize_hooks, logx, logy, padding, show_legend, show_grid, xaxis, yaxis, xlabel, ylabel, xlim, ylim, zlim, xrotation, yrotation, xticks, yticksholoviews.plotting.bokeh.plot.BokehPlot: title, title_format, shared_datasourceholoviews.plotting.bokeh.element.ElementPlot: fontsize, toolbar, width, height, active_tools, align, border, aspect, data_aspect, frame_width, frame_height, min_width, min_height, max_width, max_height, margin, responsive, gridstyle, labelled, lod, show_frame, shared_axes, default_tools, tools, xformatter, yformatter-
cleanup()¶ Cleans up references to the plot after the plot has been deleted. Traverses through all plots cleaning up Callbacks and Stream subscribers.
-
compute_ranges(obj, key, ranges)¶ Given an object, a specific key, and the normalization options, this method will find the specified normalization options on the appropriate OptionTree, group the elements according to the selected normalization option (i.e. either per frame or over the whole animation) and finally compute the dimension ranges in each group. The new set of ranges is returned.
-
property
current_handles¶ Should return a list of plot objects that have changed and should be updated.
-
property
framewise¶ Property to determine whether the current frame should have framewise normalization enabled. Required for bokeh plotting classes to determine whether to send updated ranges for each frame.
-
get_aspect(xspan, yspan)¶ Computes the aspect ratio of the plot
-
get_data(element, ranges, style)[source]¶ Returns the data from an element in the appropriate format for initializing or updating a ColumnDataSource and a dictionary which maps the expected keywords arguments of a glyph to the column in the datasource.
-
get_extents(element, ranges, range_type='combined')[source]¶ Gets the extents for the axes from the current Element. The globally computed ranges can optionally override the extents.
The extents are computed by combining the data ranges, extents and dimension ranges. Each of these can be obtained individually by setting the range_type to one of:
‘data’: Just the data ranges
‘extents’: Element.extents
‘soft’: Dimension.soft_range values
‘hard’: Dimension.range values
To obtain the combined range, which includes range padding the default may be used:
‘combined’: All the range types combined and padding applied
This allows Overlay plots to obtain each range and combine them appropriately for all the objects in the overlay.
-
get_padding(obj, extents)¶ Computes padding along the axes taking into account the plot aspect.
-
get_zorder(overlay, key, el)¶ Computes the z-order of element in the NdOverlay taking into account possible batching of elements.
-
initialize_plot(ranges=None, plot=None, plots=None, source=None)¶ Initializes a new plot object with the last available frame.
-
property
link_sources¶ Returns potential Link or Stream sources.
-
matches(spec)¶ Matches a specification against the current Plot.
-
model_changed(model)¶ Determines if the bokeh model was just changed on the frontend. Useful to suppress boomeranging events, e.g. when the frontend just sent an update to the x_range this should not trigger an update on the backend.
-
push()¶ Pushes plot updates to the frontend.
-
refresh(**kwargs)¶ Refreshes the plot by rerendering it and then pushing the updated data if the plot has an associated Comm.
-
set_root(root)¶ Sets the root model on all subplots.
-
property
state¶ The plotting state that gets updated via the update method and used by the renderer to generate output.
-
sync_sources()¶ Syncs data sources between Elements, which draw data from the same object.
-
traverse(fn=None, specs=None, full_breadth=True)¶ Traverses any nested DimensionedPlot returning a list of all plots that match the specs. The specs should be supplied as a list of either Plot types or callables, which should return a boolean given the plot class.
-
update(key)¶ Update the internal state of the Plot to represent the given key tuple (where integers represent frames). Returns this state.
-
update_frame(key, ranges=None, plot=None, element=None)¶ Updates an existing plot with data corresponding to the key.
-
util Module
-
holoviews.plotting.bokeh.util.attach_periodic(plot)[source]¶ Attaches plot refresh to all streams on the object.
-
holoviews.plotting.bokeh.util.categorize_array(array, dim)[source]¶ Uses a Dimension instance to convert an array of values to categorical (i.e. string) values and applies escaping for colons, which bokeh treats as a categorical suffix.
-
holoviews.plotting.bokeh.util.cds_column_replace(source, data)[source]¶ Determine if the CDS.data requires a full replacement or simply needs to be updated. A replacement is required if untouched columns are not the same length as the columns being updated.
-
holoviews.plotting.bokeh.util.colormesh(X, Y)[source]¶ Generates line paths for a quadmesh given 2D arrays of X and Y coordinates.
-
holoviews.plotting.bokeh.util.compute_layout_properties(width, height, frame_width, frame_height, explicit_width, explicit_height, aspect, data_aspect, responsive, size_multiplier, logger=None)[source]¶ Utility to compute the aspect, plot width/height and sizing_mode behavior.
- Args:
width (int): Plot width height (int): Plot height frame_width (int): Plot frame width frame_height (int): Plot frame height explicit_width (list): List of user supplied widths explicit_height (list): List of user supplied heights aspect (float): Plot aspect data_aspect (float): Scaling between x-axis and y-axis ranges responsive (boolean): Whether the plot should resize responsively size_multiplier (float): Multiplier for supplied plot dimensions logger (param.Parameters): Parameters object to issue warnings on
- Returns:
Returns two dictionaries one for the aspect and sizing modes, and another for the plot dimensions.
-
holoviews.plotting.bokeh.util.compute_plot_size(plot)[source]¶ Computes the size of bokeh models that make up a layout such as figures, rows, columns, widgetboxes and Plot.
-
holoviews.plotting.bokeh.util.convert_timestamp(timestamp)[source]¶ Converts bokehJS timestamp to datetime64.
-
holoviews.plotting.bokeh.util.date_to_integer(date)[source]¶ Converts support date types to milliseconds since epoch
Attempts highest precision conversion of different datetime formats to milliseconds since the epoch (1970-01-01 00:00:00). If datetime is a cftime with a non-standard calendar the caveats described in hv.core.util.cftime_to_timestamp apply.
- Args:
date: Date- or datetime-like object
- Returns:
Milliseconds since 1970-01-01 00:00:00
-
holoviews.plotting.bokeh.util.decode_bytes(array)[source]¶ Decodes an array, list or tuple of bytestrings to avoid python 3 bokeh serialization errors
-
holoviews.plotting.bokeh.util.empty_plot(width, height)[source]¶ Creates an empty and invisible plot of the specified size.
-
holoviews.plotting.bokeh.util.filter_batched_data(data, mapping)[source]¶ Iterates over the data and mapping for a ColumnDataSource and replaces columns with repeating values with a scalar. This is purely and optimization for scalar types.
-
holoviews.plotting.bokeh.util.filter_toolboxes(plots)[source]¶ Filters out toolboxes out of a list of plots to be able to compose them into a larger plot.
-
holoviews.plotting.bokeh.util.font_size_to_pixels(size)[source]¶ Convert a fontsize to a pixel value
-
holoviews.plotting.bokeh.util.get_default(model, name, theme=None)[source]¶ Looks up the default value for a bokeh model property.
-
holoviews.plotting.bokeh.util.get_tab_title(key, frame, overlay)[source]¶ Computes a title for bokeh tabs from the key in the overlay, the element and the containing (Nd)Overlay.
-
holoviews.plotting.bokeh.util.glyph_order(keys, draw_order=[])[source]¶ Orders a set of glyph handles using regular sort and an explicit sort order. The explicit draw order must take the form of a list of glyph names while the keys should be glyph names with a custom suffix. The draw order may only match subset of the keys and any matched items will take precedence over other entries.
-
holoviews.plotting.bokeh.util.hold_policy(document, policy, server=False)[source]¶ Context manager to temporary override the hold policy.
-
holoviews.plotting.bokeh.util.hsv_to_rgb(hsv)[source]¶ Vectorized HSV to RGB conversion, adapted from: http://stackoverflow.com/questions/24852345/hsv-to-rgb-color-conversion
-
holoviews.plotting.bokeh.util.layout_padding(plots, renderer)[source]¶ Pads Nones in a list of lists of plots with empty plots.
-
holoviews.plotting.bokeh.util.match_ax_type(ax, range_type)[source]¶ Ensure the range_type matches the axis model being matched.
-
holoviews.plotting.bokeh.util.match_dim_specs(specs1, specs2)[source]¶ Matches dimension specs used to link axes.
Axis dimension specs consists of a list of tuples corresponding to each dimension, each tuple spec has the form (name, label, unit). The name and label must match exactly while the unit only has to match if both specs define one.
-
holoviews.plotting.bokeh.util.multi_polygons_data(element)[source]¶ Expands polygon data which contains holes to a bokeh multi_polygons representation. Multi-polygons split by nans are expanded and the correct list of holes is assigned to each sub-polygon.
-
holoviews.plotting.bokeh.util.pad_plots(plots)[source]¶ Accepts a grid of bokeh plots in form of a list of lists and wraps any DataTable or Tabs in a WidgetBox with appropriate padding. Required to avoid overlap in gridplot.
-
holoviews.plotting.bokeh.util.pad_width(model, table_padding=0.85, tabs_padding=1.2)[source]¶ Computes the width of a model and sets up appropriate padding for Tabs and DataTable types.
-
class
holoviews.plotting.bokeh.util.periodic(document)[source]¶ Bases:
objectMocks the API of periodic Thread in hv.core.util, allowing a smooth API transition on bokeh server.
-
holoviews.plotting.bokeh.util.py2js_tickformatter(formatter, msg='')[source]¶ Uses py2js to compile a python tick formatter to JS code
-
holoviews.plotting.bokeh.util.recursive_model_update(model, props)[source]¶ Recursively updates attributes on a model including other models. If the type of the new model matches the old model properties are simply updated, otherwise the model is replaced.
-
holoviews.plotting.bokeh.util.remove_legend(plot, legend)[source]¶ Removes a legend from a bokeh plot.
-
holoviews.plotting.bokeh.util.silence_warnings(*warnings)[source]¶ Context manager for silencing bokeh validation warnings.
Context manager to ensures data sources shared between multiple plots are cleared and updated appropriately avoiding warnings and allowing empty frames on subplots. Expects a list of shared_sources and a mapping of the columns expected columns for each source in the plots handles.
-
holoviews.plotting.bokeh.util.wrap_formatter(formatter, axis)[source]¶ Wraps formatting function or string in appropriate bokeh formatter type.