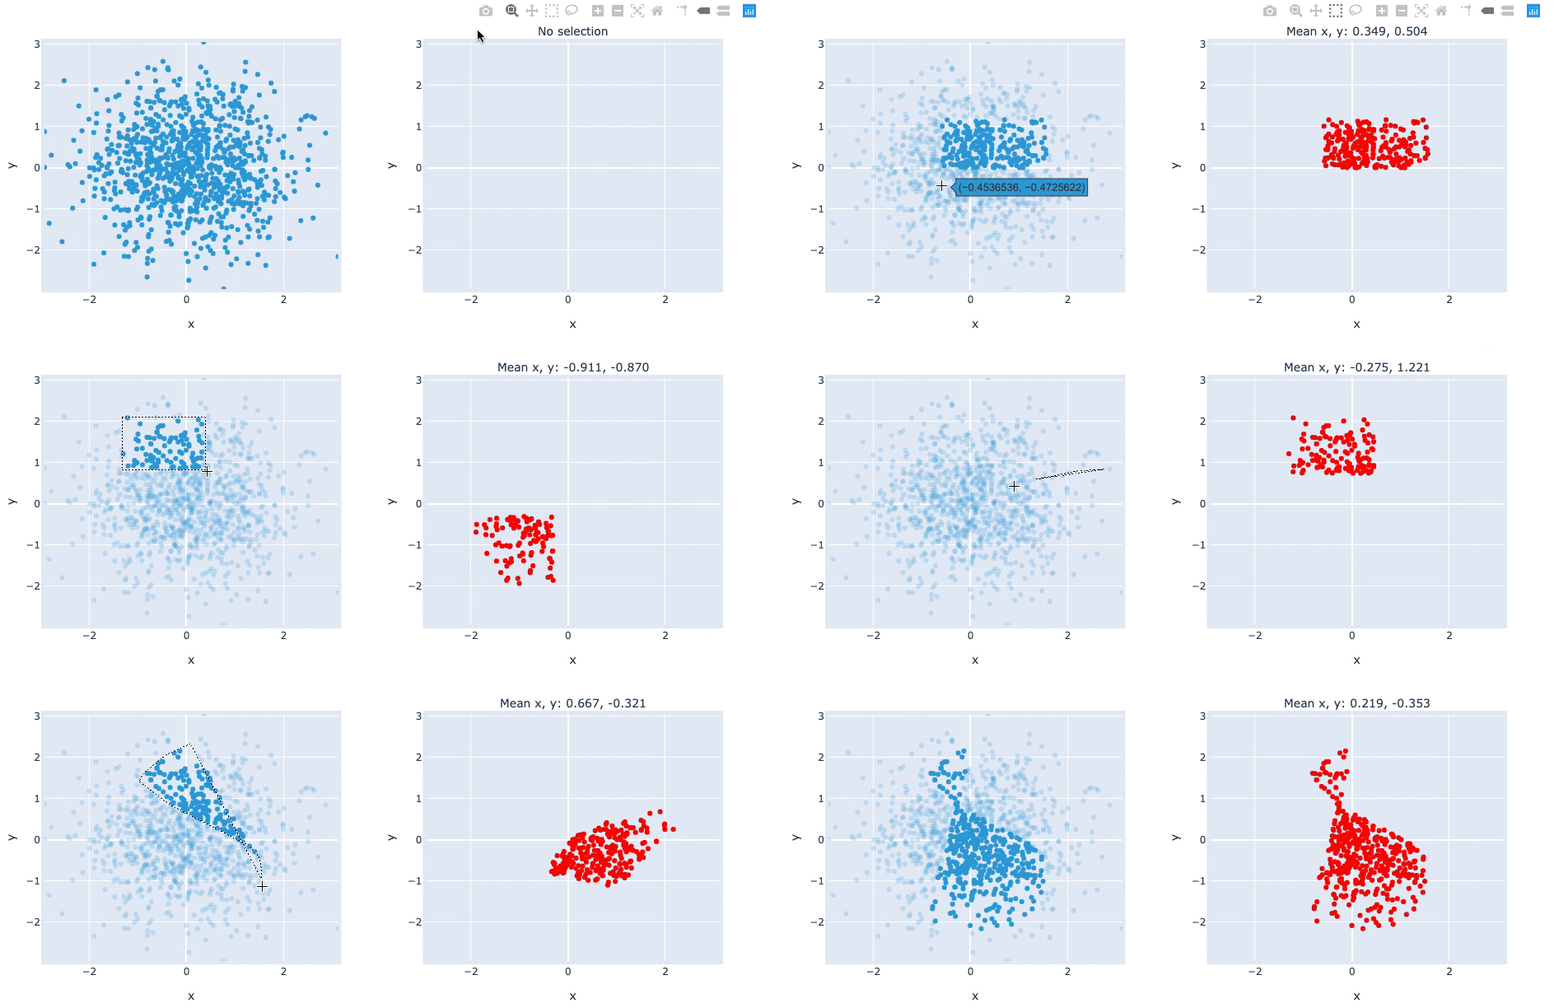
Selection1d points
Download this notebook from GitHub (right-click to download).
In [1]:
import numpy as np
import holoviews as hv
from holoviews import streams
hv.extension('plotly')
In [2]:
# Declare some points
points = hv.Points(np.random.randn(1000,2 ))

# Declare points as source of selection stream
selection = streams.Selection1D(source=points)

# Write function that uses the selection indices to slice points and compute stats
def selected_info(index):
    selected = points.iloc[index]
    if index:
        label = 'Mean x, y: %.3f, %.3f' % tuple(selected.array().mean(axis=0))
    else:
        label = 'No selection'
    return selected.relabel(label).opts(color='red')

# Combine points and DynamicMap
points + hv.DynamicMap(selected_info, streams=[selection])
Out[2]:

Download this notebook from GitHub (right-click to download).
