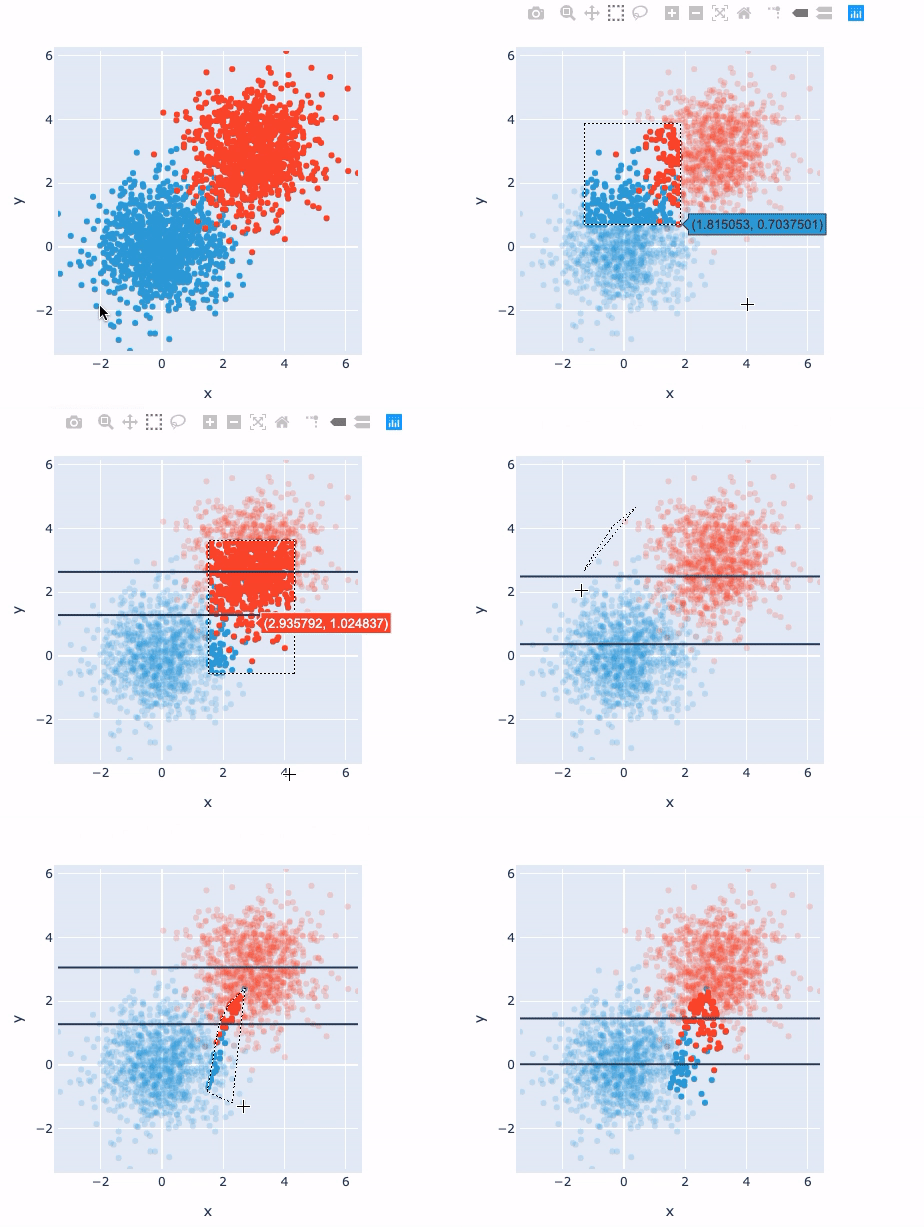
Selection1d paired
Download this notebook from GitHub (right-click to download).
In [1]:
import numpy as np
import holoviews as hv
from holoviews import opts, streams

hv.extension('plotly')
In [2]:
# Declare two sets of points generated from multivariate distribution
points = hv.Points(np.random.multivariate_normal((0, 0), [[1, 0.1], [0.1, 1]], (1000,)))
points2 = hv.Points(np.random.multivariate_normal((3, 3), [[1, 0.1], [0.1, 1]], (1000,)))

# Declare two selection streams and set points and points2 as the source of each
sel1 = streams.Selection1D(source=points)
sel2 = streams.Selection1D(source=points2)

# Declare DynamicMaps to show mean y-value of selection as HLine
hline1 = hv.DynamicMap(lambda index: hv.HLine(points['y'][index].mean() if index else -10), streams=[sel1])
hline2 = hv.DynamicMap(lambda index: hv.HLine(points2['y'][index].mean() if index else -10), streams=[sel2])

# Combine points and dynamic HLines
(points * points2 * hline1 * hline2).opts(
    opts.Points(height=400, width=400))
Out[2]:

Download this notebook from GitHub (right-click to download).
