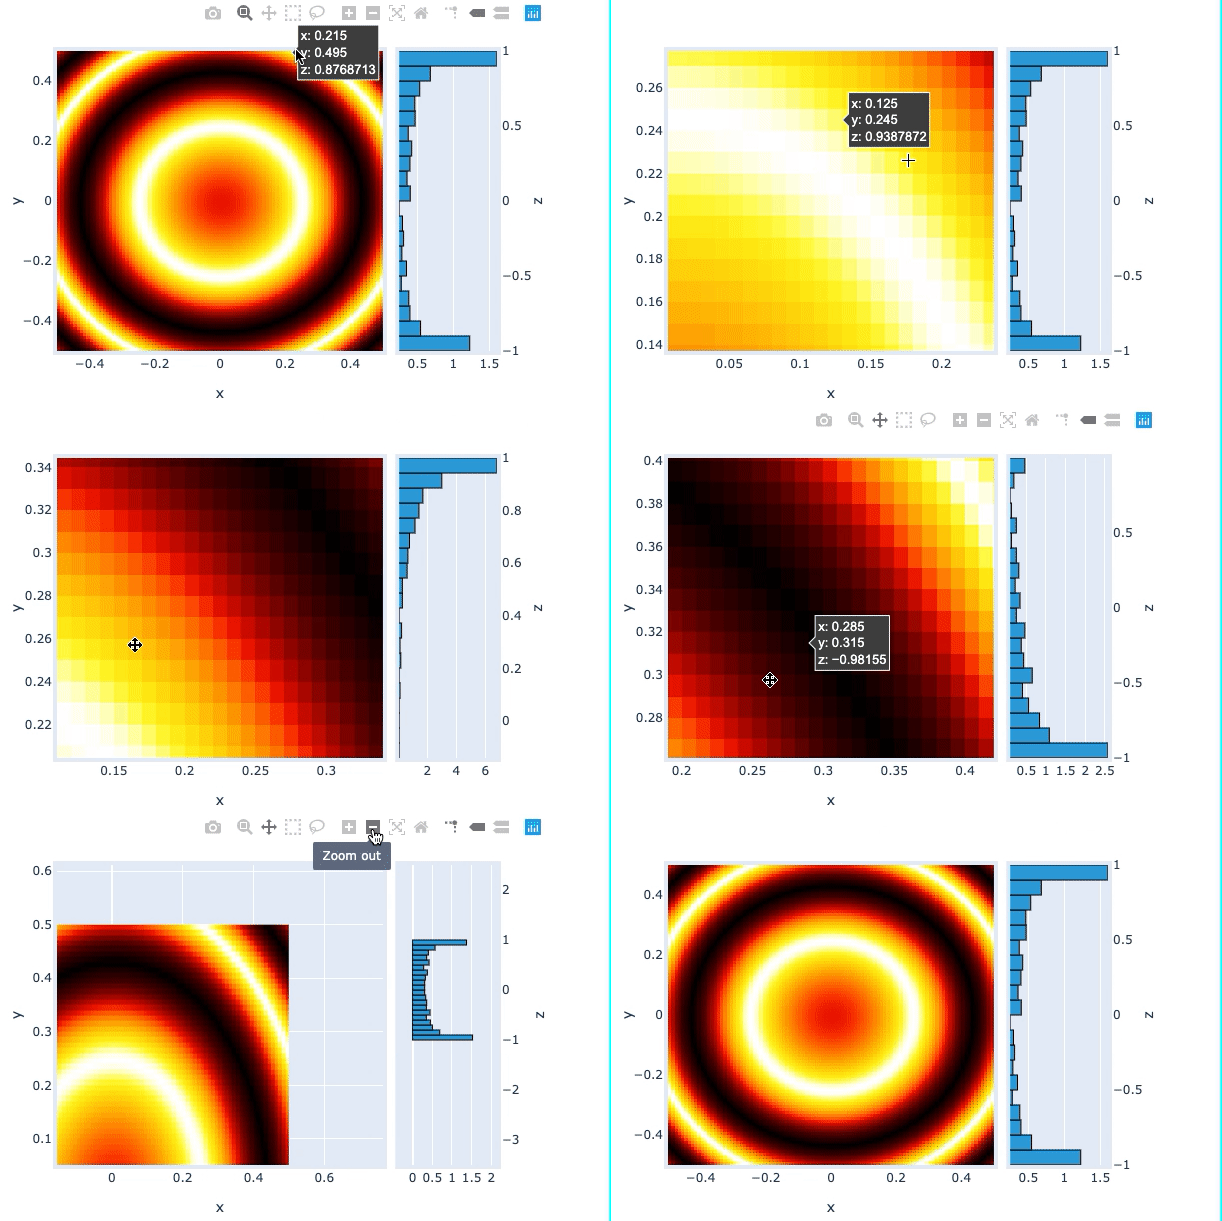
Rangexy
Download this notebook from GitHub (right-click to download).
In [1]:
import numpy as np
import holoviews as hv

hv.extension('plotly')
In [2]:
# Define an image
Y, X = (np.mgrid[0:100, 0:100]-50.)/20.
img = hv.Image(np.sin(X**2+Y**2))

def selected_hist(x_range, y_range):
    # Apply current ranges
    obj = img.select(x=x_range, y=y_range) if x_range and y_range else img

    # Compute histogram
    return hv.operation.histogram(obj)

# Define a RangeXY stream linked to the image
rangexy = hv.streams.RangeXY(source=img)

# Adjoin the dynamic histogram computed based on the current ranges
img << hv.DynamicMap(selected_hist, streams=[rangexy])
Out[2]:

Download this notebook from GitHub (right-click to download).
