Polydraw
Download this notebook from GitHub (right-click to download).
import holoviews as hv
from holoviews import opts, streams

hv.extension('bokeh')
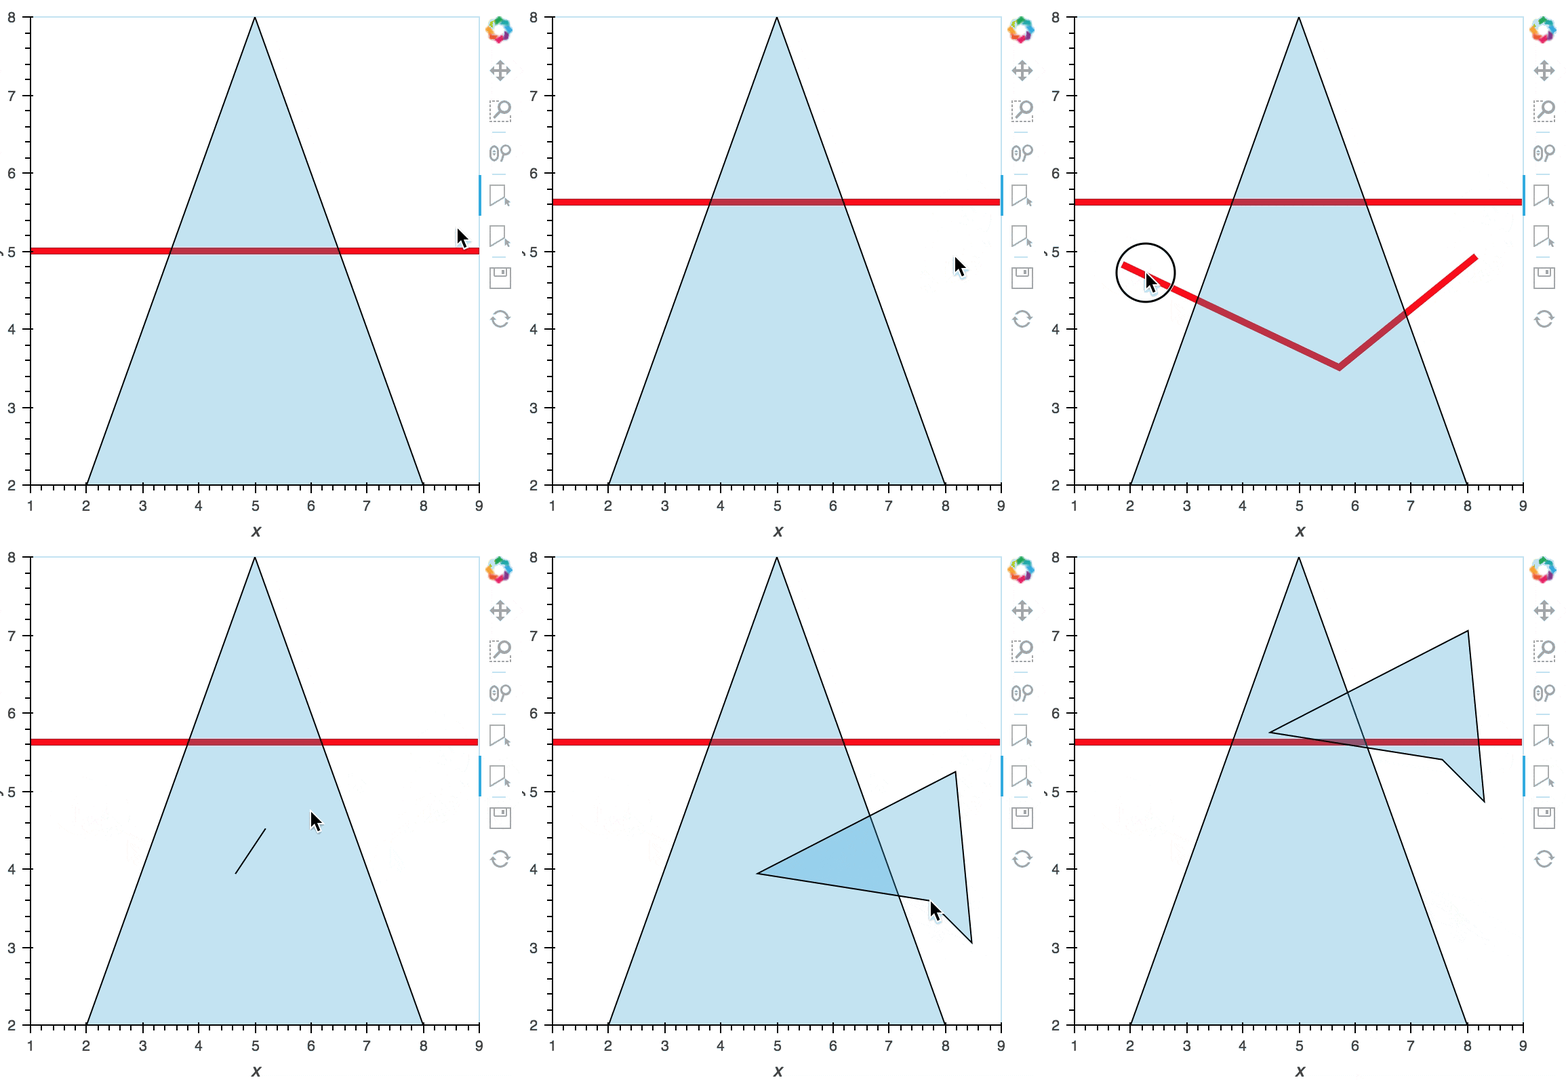
The PolyDraw stream adds a bokeh tool to the source plot, which allows drawing, dragging and deleting polygons and making the drawn data available to Python. The tool supports the following actions:
Add patch/multi-line
Double tap to add the first vertex, then use tap to add each subsequent vertex, to finalize the draw action double tap to insert the final vertex or press the ESC key to stop drawing.
Move patch/multi-line
Tap and drag an existing patch/multi-line; the point will be dropped once you let go of the mouse button.
Delete patch/multi-line
Tap a patch/multi-line to select it then press BACKSPACE key while the mouse is within the plot area.
Properties
drag(boolean): Whether to enable dragging of paths and polygonsempty_value: Value to add to non-coordinate columns when adding new path or polygonnum_objects(int): Maximum number of paths or polygons to draw before deleting the oldest objectshow_vertices(boolean): Whether to show the vertices of the paths or polygonsstyles(dict): Dictionary of style properties (e.g. line_color, line_width etc.) to apply to each path and polygon. If values are lists the values will cycle over the values)vertex_style(dict): Dictionary of style properties (e.g. fill_color, line_width etc.) to apply to vertices ifshow_verticesenabled
As a simple example we will create simple Path and Polygons elements and attach each to a PolyDraw stream. We will also enable the drag option on the stream to enable dragging of existing glyphs. Additionally we can enable the show_vertices option which shows the vertices of the drawn polygons/lines and adds the ability to snap to them. Finally the num_objects option limits the number of lines/polygons that can be drawn by dropping the first glyph when the limit is exceeded.
path = hv.Path([[(1, 5), (9, 5)]])
poly = hv.Polygons([[(2, 2), (5, 8), (8, 2)]])
path_stream = streams.PolyDraw(source=path, drag=True, show_vertices=True)
poly_stream = streams.PolyDraw(source=poly, drag=True, num_objects=4,
                               show_vertices=True, styles={
                                   'fill_color': ['red', 'green', 'blue']
                               })

(path * poly).opts(
    opts.Path(color='red', height=400, line_width=5, width=400),
    opts.Polygons(fill_alpha=0.3, active_tools=['poly_draw']))

Whenever the data source is edited the data is synced with Python, both in the notebook and when deployed on the bokeh server. The data is made available as a dictionary of columns:
path_stream.data
Alternatively we can use the element property to get an Element containing the returned data:
path_stream.element * poly_stream.element
Download this notebook from GitHub (right-click to download).
