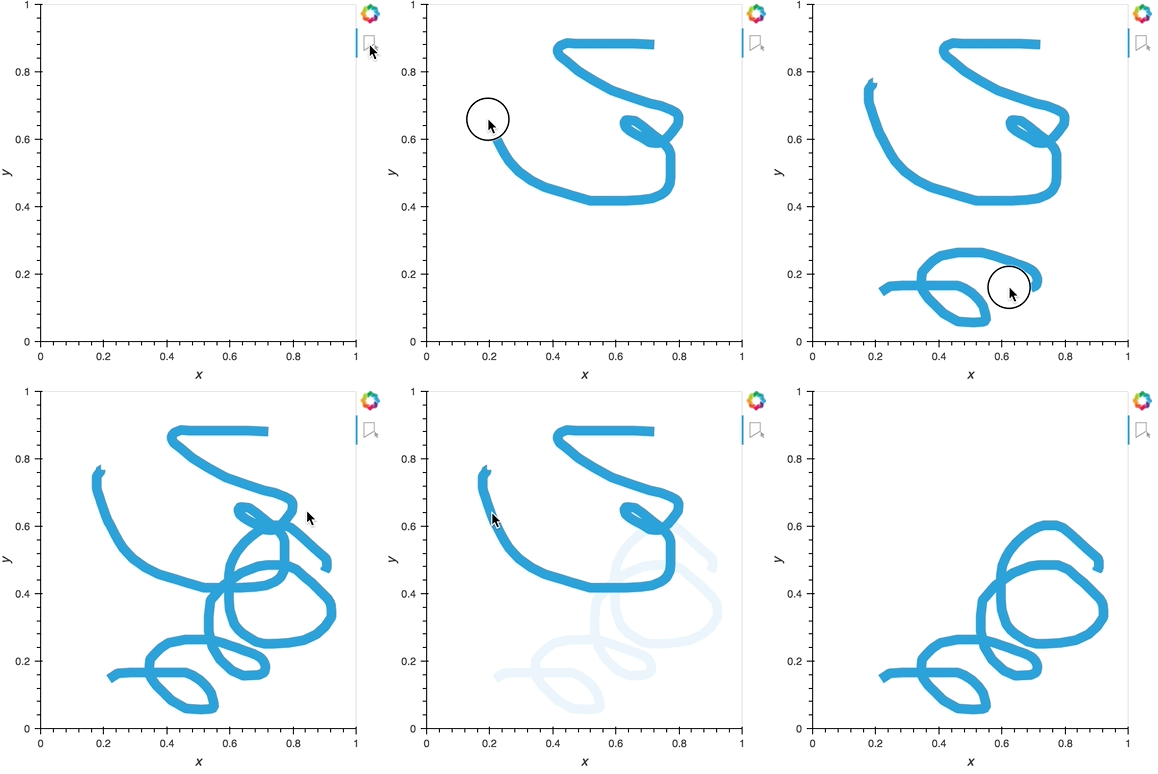
Freehanddraw
Download this notebook from GitHub (right-click to download).
import holoviews as hv
from holoviews import opts
from holoviews import streams
hv.extension('bokeh')
The FreehandDraw stream adds a bokeh tool to the source plot, which allows freehand drawing on the plot canvas and makes the resulting paths available to Python. The tool supports the following actions:
Draw
Click and drag to draw a line or polygon, release mouse to stop drawing
Delete line
Tap a line to select it then press BACKSPACE key while the mouse is within the plot area.
Properties
empty_value: Value to add to non-coordinate columns when adding new pathnum_objects(int): Maximum number of paths to draw before deleting the oldest objectstyles(dict): Dictionary of style properties (e.g. line_color, line_width etc.) to apply to each path. If values are lists the values will cycle over the values.
The tool allows drawing lines and polygons by supplying it with a Path or Polygons object as a source. It also allows limiting the number of lines or polygons that can be drawn by setting num_objects to a finite number, causing the first line to be dropped when the limit is reached.
path = hv.Path([])
freehand = streams.FreehandDraw(source=path, num_objects=3,
                                styles={'line_color': ['red', 'green', 'blue']})

path.opts(
    opts.Path(active_tools=['freehand_draw'], height=400, line_width=10, width=400))

Whenever the data source is edited the data is synced with Python, both in the notebook and when deployed on the bokeh server. The data is made available as a dictionary of columns:
freehand.data
Alternatively we can use the element property to get an Element containing the returned data:
freehand.element
Download this notebook from GitHub (right-click to download).
