Box draw roi editor
Download this notebook from GitHub (right-click to download).
In [1]:
import numpy as np
import holoviews as hv
from holoviews import opts
from holoviews import streams
hv.extension('bokeh')
Declaring data
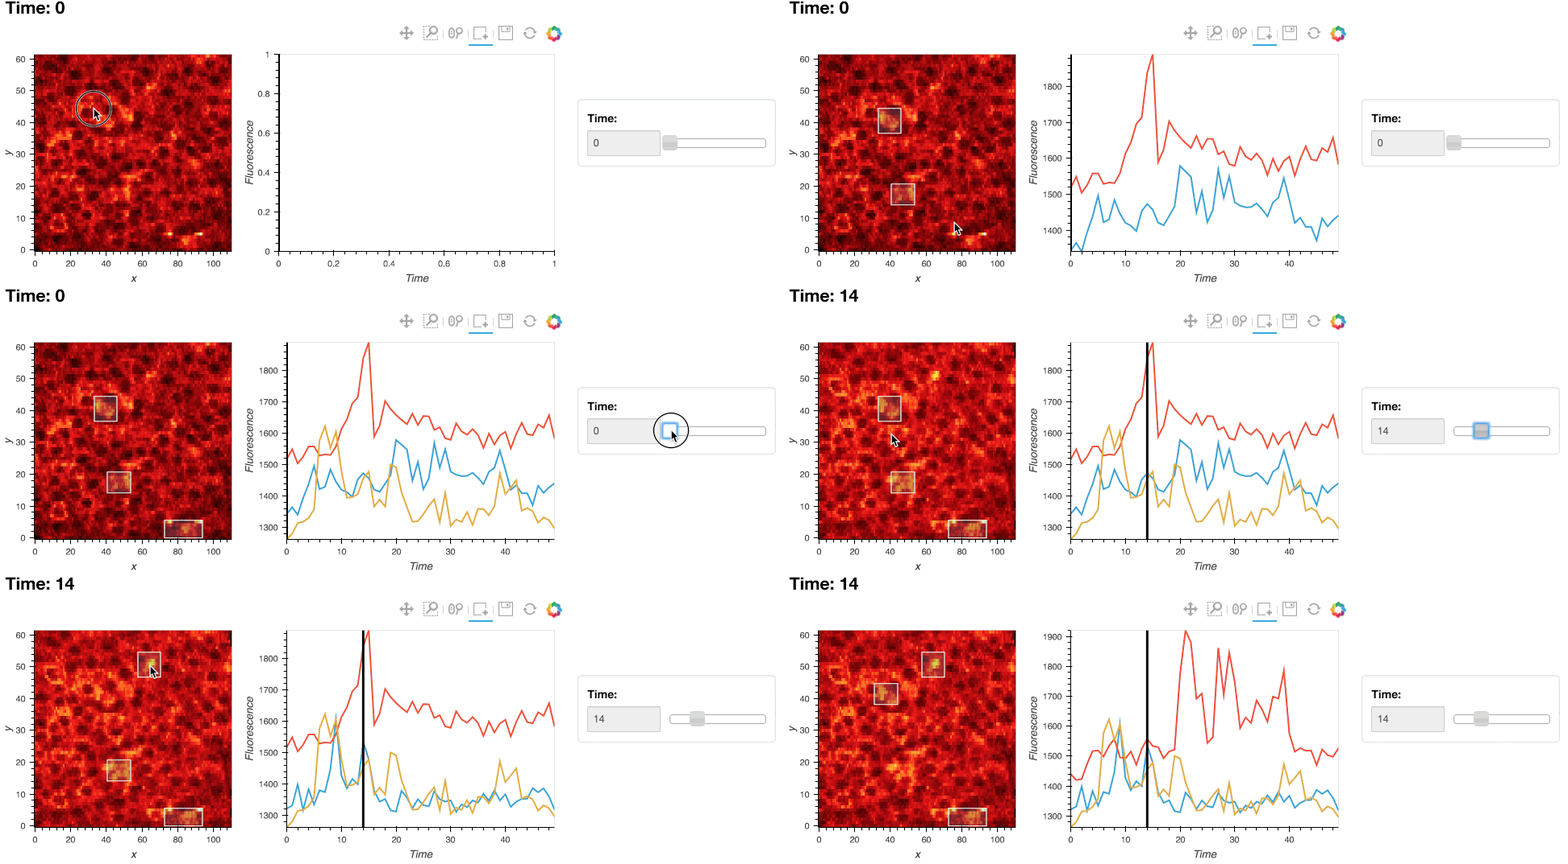
In this example we will use the BoxDraw stream to draw ROIs over a set of neural calcium imaging data, and use them to compute and display timeseries of the activity in the regions of interests.
In [2]:
data = np.load('../../../assets/twophoton.npz')
calcium_array = data['Calcium']
ds = hv.Dataset((np.arange(50), np.arange(111), np.arange(62), calcium_array),
                ['Time', 'x', 'y'], 'Fluorescence')

polys = hv.Polygons([])
box_stream = streams.BoxEdit(source=polys)

def roi_curves(data):
    if not data or not any(len(d) for d in data.values()):
        return hv.NdOverlay({0: hv.Curve([], 'Time', 'Fluorescence')})

    curves = {}
    data = zip(data['x0'], data['x1'], data['y0'], data['y1'])
    for i, (x0, x1, y0, y1) in enumerate(data):
        selection = ds.select(x=(x0, x1), y=(y0, y1))
        curves[i] = hv.Curve(selection.aggregate('Time', np.mean))
    return hv.NdOverlay(curves)

hlines = hv.HoloMap({i: hv.VLine(i) for i in range(50)}, 'Time')
dmap = hv.DynamicMap(roi_curves, streams=[box_stream])
Plot
To define an ROI, select the 'Box edit' tool and double click to start defining the ROI and double click to finish placing the ROI:
In [3]:
im = ds.to(hv.Image, ['x', 'y'], dynamic=True)
(im * polys + dmap * hlines).opts(
    opts.Curve(width=400, framewise=True),
    opts.Polygons(fill_alpha=0.2, line_color='white'),
    opts.VLine(color='black'))
Out[3]:

Download this notebook from GitHub (right-click to download).
